Bolivian vs Greek Child Poverty Among Girls Under 16
COMPARE
Bolivian
Greek
Child Poverty Among Girls Under 16
Child Poverty Among Girls Under 16 Comparison
Bolivians
Greeks
13.6%
CHILD POVERTY AMONG GIRLS UNDER 16
99.8/ 100
METRIC RATING
29th/ 347
METRIC RANK
14.2%
CHILD POVERTY AMONG GIRLS UNDER 16
99.2/ 100
METRIC RATING
49th/ 347
METRIC RANK
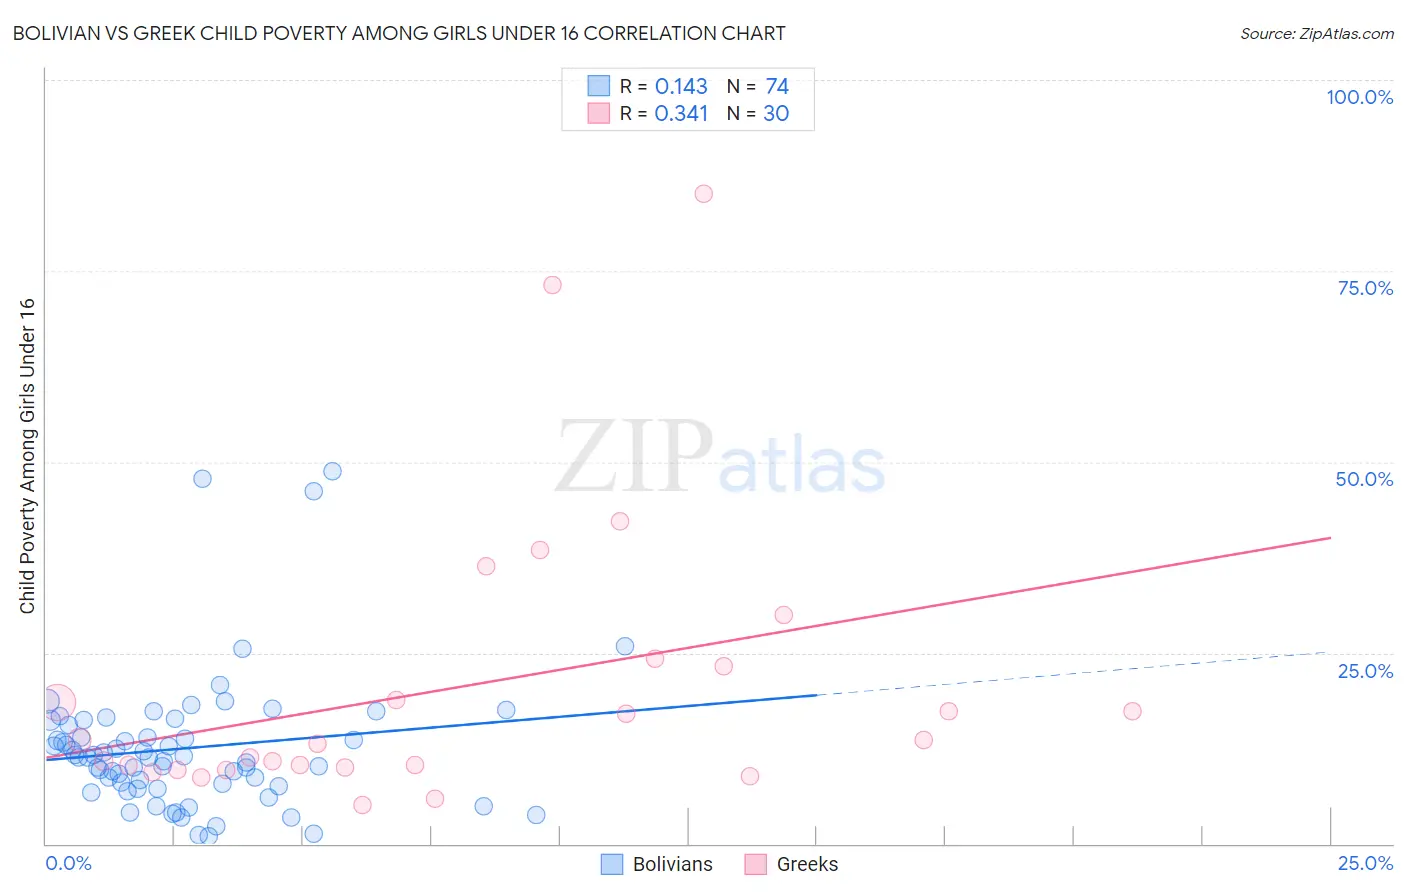
Bolivian vs Greek Child Poverty Among Girls Under 16 Correlation Chart
The statistical analysis conducted on geographies consisting of 183,239,714 people shows a poor positive correlation between the proportion of Bolivians and poverty level among girls under the age of 16 in the United States with a correlation coefficient (R) of 0.143 and weighted average of 13.6%. Similarly, the statistical analysis conducted on geographies consisting of 468,807,341 people shows a mild positive correlation between the proportion of Greeks and poverty level among girls under the age of 16 in the United States with a correlation coefficient (R) of 0.341 and weighted average of 14.2%, a difference of 4.3%.
Child Poverty Among Girls Under 16 Correlation Summary
| Measurement | Bolivian | Greek |
| Minimum | 1.0% | 5.0% |
| Maximum | 48.7% | 85.1% |
| Range | 47.7% | 80.1% |
| Mean | 12.5% | 20.4% |
| Median | 11.3% | 13.3% |
| Interquartile 25% (IQ1) | 7.5% | 10.0% |
| Interquartile 75% (IQ3) | 15.5% | 23.2% |
| Interquartile Range (IQR) | 8.1% | 13.2% |
| Standard Deviation (Sample) | 9.0% | 18.6% |
| Standard Deviation (Population) | 8.9% | 18.3% |
Demographics Similar to Bolivians and Greeks by Child Poverty Among Girls Under 16
In terms of child poverty among girls under 16, the demographic groups most similar to Bolivians are Asian (13.7%, a difference of 0.67%), Turkish (13.7%, a difference of 0.79%), Danish (13.7%, a difference of 0.83%), Swedish (13.7%, a difference of 0.87%), and Maltese (13.7%, a difference of 0.92%). Similarly, the demographic groups most similar to Greeks are Czech (14.2%, a difference of 0.040%), Immigrants from Czechoslovakia (14.2%, a difference of 0.060%), Croatian (14.1%, a difference of 0.080%), Immigrants from Greece (14.1%, a difference of 0.11%), and Immigrants from Asia (14.1%, a difference of 0.62%).
| Demographics | Rating | Rank | Child Poverty Among Girls Under 16 |
| Bolivians | 99.8 /100 | #29 | Exceptional 13.6% |
| Asians | 99.7 /100 | #30 | Exceptional 13.7% |
| Turks | 99.7 /100 | #31 | Exceptional 13.7% |
| Danes | 99.7 /100 | #32 | Exceptional 13.7% |
| Swedes | 99.7 /100 | #33 | Exceptional 13.7% |
| Maltese | 99.7 /100 | #34 | Exceptional 13.7% |
| Immigrants | Northern Europe | 99.6 /100 | #35 | Exceptional 13.8% |
| Russians | 99.6 /100 | #36 | Exceptional 13.9% |
| Lithuanians | 99.6 /100 | #37 | Exceptional 13.9% |
| Immigrants | Moldova | 99.6 /100 | #38 | Exceptional 13.9% |
| Immigrants | Australia | 99.5 /100 | #39 | Exceptional 14.0% |
| Immigrants | Sri Lanka | 99.5 /100 | #40 | Exceptional 14.0% |
| Immigrants | Bolivia | 99.5 /100 | #41 | Exceptional 14.0% |
| Immigrants | Scotland | 99.4 /100 | #42 | Exceptional 14.0% |
| Koreans | 99.4 /100 | #43 | Exceptional 14.1% |
| Immigrants | Asia | 99.4 /100 | #44 | Exceptional 14.1% |
| Immigrants | Greece | 99.3 /100 | #45 | Exceptional 14.1% |
| Croatians | 99.3 /100 | #46 | Exceptional 14.1% |
| Immigrants | Czechoslovakia | 99.3 /100 | #47 | Exceptional 14.2% |
| Czechs | 99.3 /100 | #48 | Exceptional 14.2% |
| Greeks | 99.2 /100 | #49 | Exceptional 14.2% |