Black/African American vs Irish Child Poverty Among Boys Under 16
COMPARE
Black/African American
Irish
Child Poverty Among Boys Under 16
Child Poverty Among Boys Under 16 Comparison
Blacks/African Americans
Irish
24.5%
CHILD POVERTY AMONG BOYS UNDER 16
0.0/ 100
METRIC RATING
334th/ 347
METRIC RANK
15.2%
CHILD POVERTY AMONG BOYS UNDER 16
93.8/ 100
METRIC RATING
113th/ 347
METRIC RANK
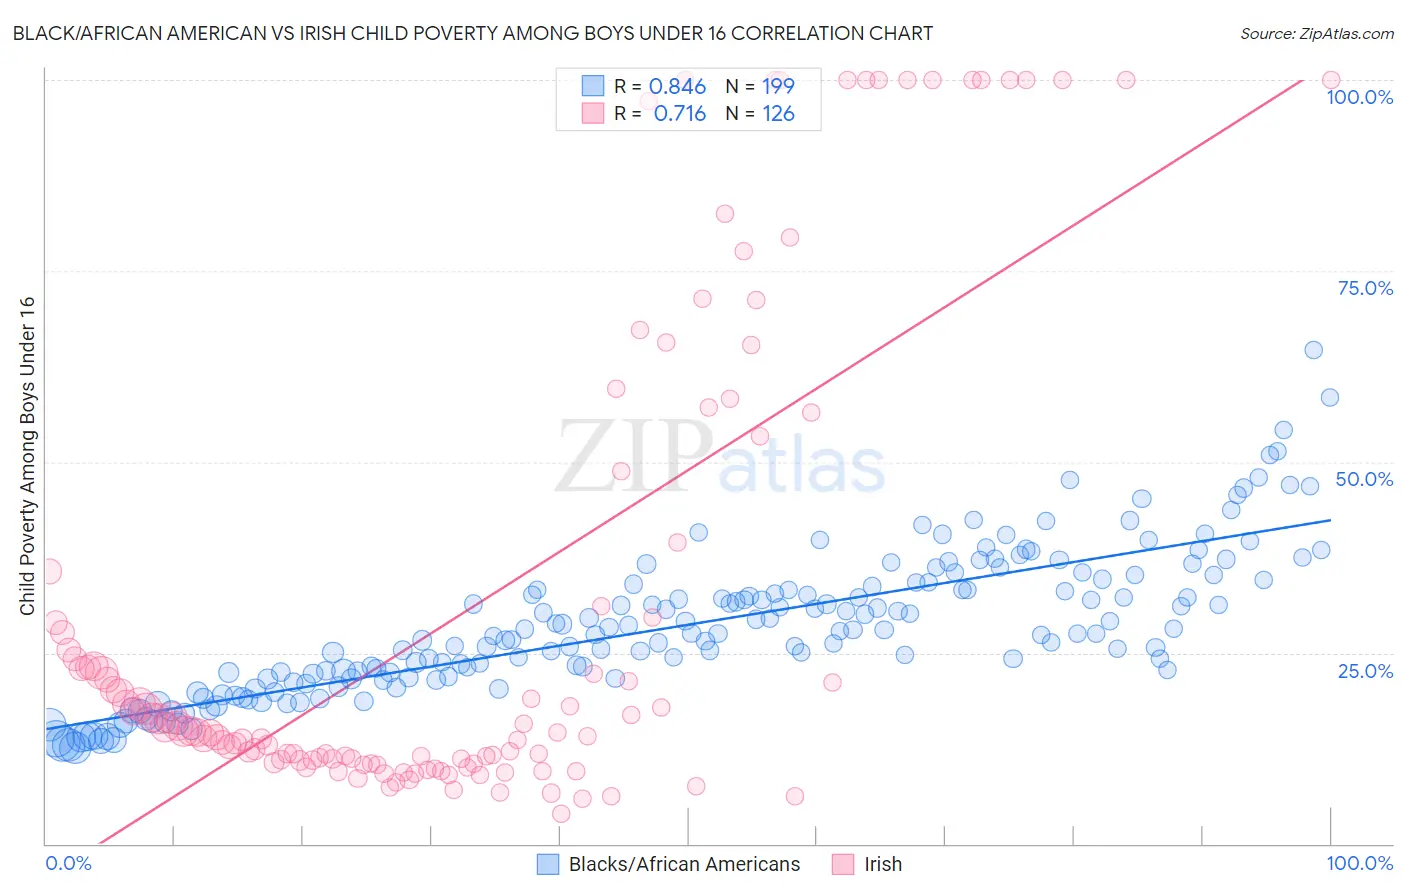
Black/African American vs Irish Child Poverty Among Boys Under 16 Correlation Chart
The statistical analysis conducted on geographies consisting of 548,051,875 people shows a very strong positive correlation between the proportion of Blacks/African Americans and poverty level among boys under the age of 16 in the United States with a correlation coefficient (R) of 0.846 and weighted average of 24.5%. Similarly, the statistical analysis conducted on geographies consisting of 557,205,083 people shows a strong positive correlation between the proportion of Irish and poverty level among boys under the age of 16 in the United States with a correlation coefficient (R) of 0.716 and weighted average of 15.2%, a difference of 61.5%.
Child Poverty Among Boys Under 16 Correlation Summary
| Measurement | Black/African American | Irish |
| Minimum | 12.5% | 3.8% |
| Maximum | 64.6% | 100.0% |
| Range | 52.1% | 96.2% |
| Mean | 28.6% | 30.9% |
| Median | 27.6% | 14.7% |
| Interquartile 25% (IQ1) | 21.9% | 10.9% |
| Interquartile 75% (IQ3) | 34.0% | 35.6% |
| Interquartile Range (IQR) | 12.1% | 24.7% |
| Standard Deviation (Sample) | 9.3% | 31.5% |
| Standard Deviation (Population) | 9.3% | 31.4% |
Similar Demographics by Child Poverty Among Boys Under 16
Demographics Similar to Blacks/African Americans by Child Poverty Among Boys Under 16
In terms of child poverty among boys under 16, the demographic groups most similar to Blacks/African Americans are Apache (24.5%, a difference of 0.12%), Immigrants from Dominican Republic (24.3%, a difference of 0.84%), Yup'ik (24.7%, a difference of 0.85%), Dominican (24.2%, a difference of 1.4%), and Colville (24.1%, a difference of 1.8%).
| Demographics | Rating | Rank | Child Poverty Among Boys Under 16 |
| Immigrants | Honduras | 0.0 /100 | #327 | Tragic 22.8% |
| Pueblo | 0.0 /100 | #328 | Tragic 23.5% |
| Natives/Alaskans | 0.0 /100 | #329 | Tragic 24.0% |
| Colville | 0.0 /100 | #330 | Tragic 24.1% |
| Dominicans | 0.0 /100 | #331 | Tragic 24.2% |
| Immigrants | Dominican Republic | 0.0 /100 | #332 | Tragic 24.3% |
| Apache | 0.0 /100 | #333 | Tragic 24.5% |
| Blacks/African Americans | 0.0 /100 | #334 | Tragic 24.5% |
| Yup'ik | 0.0 /100 | #335 | Tragic 24.7% |
| Sioux | 0.0 /100 | #336 | Tragic 25.3% |
| Cheyenne | 0.0 /100 | #337 | Tragic 25.8% |
| Hopi | 0.0 /100 | #338 | Tragic 25.9% |
| Houma | 0.0 /100 | #339 | Tragic 26.2% |
| Crow | 0.0 /100 | #340 | Tragic 26.3% |
| Immigrants | Yemen | 0.0 /100 | #341 | Tragic 28.9% |
Demographics Similar to Irish by Child Poverty Among Boys Under 16
In terms of child poverty among boys under 16, the demographic groups most similar to Irish are Basque (15.2%, a difference of 0.040%), Immigrants from Ukraine (15.2%, a difference of 0.050%), Armenian (15.2%, a difference of 0.070%), Immigrants from South Eastern Asia (15.2%, a difference of 0.11%), and Immigrants from Vietnam (15.2%, a difference of 0.13%).
| Demographics | Rating | Rank | Child Poverty Among Boys Under 16 |
| Serbians | 95.2 /100 | #106 | Exceptional 15.1% |
| Jordanians | 95.1 /100 | #107 | Exceptional 15.1% |
| Immigrants | England | 94.8 /100 | #108 | Exceptional 15.1% |
| Pakistanis | 94.7 /100 | #109 | Exceptional 15.1% |
| English | 94.3 /100 | #110 | Exceptional 15.1% |
| Immigrants | Zimbabwe | 94.2 /100 | #111 | Exceptional 15.2% |
| Basques | 93.8 /100 | #112 | Exceptional 15.2% |
| Irish | 93.8 /100 | #113 | Exceptional 15.2% |
| Immigrants | Ukraine | 93.6 /100 | #114 | Exceptional 15.2% |
| Armenians | 93.6 /100 | #115 | Exceptional 15.2% |
| Immigrants | South Eastern Asia | 93.5 /100 | #116 | Exceptional 15.2% |
| Immigrants | Vietnam | 93.5 /100 | #117 | Exceptional 15.2% |
| Native Hawaiians | 93.4 /100 | #118 | Exceptional 15.2% |
| Belgians | 93.1 /100 | #119 | Exceptional 15.2% |
| South Africans | 93.0 /100 | #120 | Exceptional 15.2% |