Blackfeet vs Immigrants from Peru Female Poverty Among 18-24 Year Olds

COMPARE

Blackfeet
Race
Ancestry
AfghanAfricanAlaska NativeAlaskan AthabascanAlbanianAleutAlsatianAmericanApacheArabArapahoArgentineanArmenianAssyrian/Chaldean/SyriacAustralianAustrianBahamianBangladeshiBarbadianBasqueBelgianBelizeanBermudanBhutaneseBlackfeetBolivianBrazilianBritishBritish West IndianBulgarianBurmeseCajunCambodianCanadianCape VerdeanCarpatho RusynCelticCentral AmericanCentral American IndianCherokeeCheyenneChickasawChileanChineseChippewaChoctawColombianColvilleComancheCosta RicanCreeCreekCroatianCrowCubanCypriotCzechCzechoslovakianDanishDelawareDominicanDutchDutch West IndianEastern EuropeanEcuadorianEgyptianEnglishEstonianEthiopianEuropeanFijianFilipinoFinnishFrenchFrench American IndianFrench CanadianGermanGerman RussianGhanaianGreekGuamanian/ChamorroGuatemalanGuyaneseHaitianHmongHonduranHopiHoumaHungarianIcelanderIndian (Asian)IndonesianInupiatIranianIraqiIrishIroquoisIsraeliItalianJamaicanJapaneseJordanianKenyanKiowaKoreanLaotianLatvianLebaneseLiberianLithuanianLumbeeLuxembourgerMacedonianMalaysianMalteseMarshalleseMenomineeMexicanMexican American IndianMongolianMoroccanNative HawaiianNavajoNepaleseNew ZealanderNicaraguanNigerianNorthern EuropeanNorwegianOkinawanOsageOttawaPaiutePakistaniPalestinianPanamanianParaguayanPennsylvania GermanPeruvianPimaPolishPortuguesePotawatomiPuebloPuerto RicanPuget Sound SalishRomanianRussianSalvadoranSamoanScandinavianScotch-IrishScottishSeminoleSenegaleseSerbianShoshoneSierra LeoneanSiouxSlavicSlovakSloveneSomaliSouth AfricanSouth AmericanSouth American IndianSoviet UnionSpaniardSpanishSpanish AmericanSpanish American IndianSri LankanSubsaharan AfricanSudaneseSwedishSwissSyrianTaiwaneseThaiTlingit-HaidaTohono O'OdhamTonganTrinidadian and TobagonianTsimshianTurkishU.S. Virgin IslanderUgandanUkrainianUruguayanUteVenezuelanVietnameseWelshWest IndianYakamaYaquiYugoslavianYumanYup'ikZimbabwean
Immigration
NonimmigrantsImmigrantsAfghanistanAfricaAlbaniaArgentinaArmeniaAsiaAustraliaAustriaBahamasBangladeshBarbadosBelarusBelgiumBelizeBoliviaBosnia and HerzegovinaBrazilBulgariaBurma/MyanmarCabo VerdeCambodiaCameroonCanadaCaribbeanCentral AmericaChileChinaColombiaCongoCosta RicaCroatiaCubaCzechoslovakiaDenmarkDominicaDominican RepublicEastern AfricaEastern AsiaEastern EuropeEcuadorEgyptEl SalvadorEnglandEritreaEthiopiaEuropeFijiFranceGermanyGhanaGreeceGrenadaGuatemalaGuyanaHaitiHondurasHong KongHungaryIndiaIndonesiaIranIraqIrelandIsraelItalyJamaicaJapanJordanKazakhstanKenyaKoreaKuwaitLaosLatin AmericaLatviaLebanonLiberiaLithuaniaMalaysiaMexicoMicronesiaMiddle AfricaMoldovaMoroccoNepalNetherlandsNicaraguaNigeriaNorth AmericaNorth MacedoniaNorthern AfricaNorthern EuropeNorwayOceaniaPakistanPanamaPhilippinesPolandPortugalRomaniaRussiaSaudi ArabiaScotlandSenegalSerbiaSierra LeoneSingaporeSomaliaSouth AfricaSouth AmericaSouth Central AsiaSouth Eastern AsiaSouthern EuropeSpainSri LankaSt. Vincent and the GrenadinesSudanSwedenSwitzerlandSyriaTaiwanThailandTrinidad and TobagoTurkeyUgandaUkraineUruguayUzbekistanVenezuelaVietnamWest IndiesWestern AfricaWestern AsiaWestern EuropeYemenZaireZimbabweAzores
Immigrants from Peru
Race
Ancestry
AfghanAfricanAlaska NativeAlaskan AthabascanAlbanianAleutAlsatianAmericanApacheArabArapahoArgentineanArmenianAssyrian/Chaldean/SyriacAustralianAustrianBahamianBangladeshiBarbadianBasqueBelgianBelizeanBermudanBhutaneseBolivianBrazilianBritishBritish West IndianBulgarianBurmeseCajunCambodianCanadianCape VerdeanCarpatho RusynCelticCentral AmericanCentral American IndianCherokeeCheyenneChickasawChileanChineseChippewaChoctawColombianColvilleComancheCosta RicanCreeCreekCroatianCrowCubanCypriotCzechCzechoslovakianDanishDelawareDominicanDutchDutch West IndianEastern EuropeanEcuadorianEgyptianEnglishEstonianEthiopianEuropeanFijianFilipinoFinnishFrenchFrench American IndianFrench CanadianGermanGerman RussianGhanaianGreekGuamanian/ChamorroGuatemalanGuyaneseHaitianHmongHonduranHopiHoumaHungarianIcelanderIndian (Asian)IndonesianInupiatIranianIraqiIrishIroquoisIsraeliItalianJamaicanJapaneseJordanianKenyanKiowaKoreanLaotianLatvianLebaneseLiberianLithuanianLumbeeLuxembourgerMacedonianMalaysianMalteseMarshalleseMenomineeMexicanMexican American IndianMongolianMoroccanNative HawaiianNavajoNepaleseNew ZealanderNicaraguanNigerianNorthern EuropeanNorwegianOkinawanOsageOttawaPaiutePakistaniPalestinianPanamanianParaguayanPennsylvania GermanPeruvianPimaPolishPortuguesePotawatomiPuebloPuerto RicanPuget Sound SalishRomanianRussianSalvadoranSamoanScandinavianScotch-IrishScottishSeminoleSenegaleseSerbianShoshoneSierra LeoneanSiouxSlavicSlovakSloveneSomaliSouth AfricanSouth AmericanSouth American IndianSoviet UnionSpaniardSpanishSpanish AmericanSpanish American IndianSri LankanSubsaharan AfricanSudaneseSwedishSwissSyrianTaiwaneseThaiTlingit-HaidaTohono O'OdhamTonganTrinidadian and TobagonianTsimshianTurkishU.S. Virgin IslanderUgandanUkrainianUruguayanUteVenezuelanVietnameseWelshWest IndianYakamaYaquiYugoslavianYumanYup'ikZimbabwean
Immigration
NonimmigrantsImmigrantsAfghanistanAfricaAlbaniaArgentinaArmeniaAsiaAustraliaAustriaBahamasBangladeshBarbadosBelarusBelgiumBelizeBoliviaBosnia and HerzegovinaBrazilBulgariaBurma/MyanmarCabo VerdeCambodiaCameroonCanadaCaribbeanCentral AmericaChileChinaColombiaCongoCosta RicaCroatiaCubaCzechoslovakiaDenmarkDominicaDominican RepublicEastern AfricaEastern AsiaEastern EuropeEcuadorEgyptEl SalvadorEnglandEritreaEthiopiaEuropeFijiFranceGermanyGhanaGreeceGrenadaGuatemalaGuyanaHaitiHondurasHong KongHungaryIndiaIndonesiaIranIraqIrelandIsraelItalyJamaicaJapanJordanKazakhstanKenyaKoreaKuwaitLaosLatin AmericaLatviaLebanonLiberiaLithuaniaMalaysiaMexicoMicronesiaMiddle AfricaMoldovaMoroccoNepalNetherlandsNicaraguaNigeriaNorth AmericaNorth MacedoniaNorthern AfricaNorthern EuropeNorwayOceaniaPakistanPanamaPeruPhilippinesPolandPortugalRomaniaRussiaSaudi ArabiaScotlandSenegalSerbiaSierra LeoneSingaporeSomaliaSouth AfricaSouth AmericaSouth Central AsiaSouth Eastern AsiaSouthern EuropeSpainSri LankaSt. Vincent and the GrenadinesSudanSwedenSwitzerlandSyriaTaiwanThailandTrinidad and TobagoTurkeyUgandaUkraineUruguayUzbekistanVenezuelaVietnamWest IndiesWestern AfricaWestern AsiaWestern EuropeYemenZaireZimbabweAzores
Female Poverty Among 18-24 Year Olds
Income
Poverty
Unemployment
Labor Participation
Family Structure
Vehicle Availability
Education Level
Disability

Female Poverty Among 18-24 Year Olds Comparison

Blackfeet

Immigrants from Peru

Tragic
Exceptional
23.6%
FEMALE POVERTY AMONG 18-24 YEAR OLDS
0.0/ 100
METRIC RATING
309th/ 347
METRIC RANK
16.9%
FEMALE POVERTY AMONG 18-24 YEAR OLDS
100.0/ 100
METRIC RATING
9th/ 347
METRIC RANK

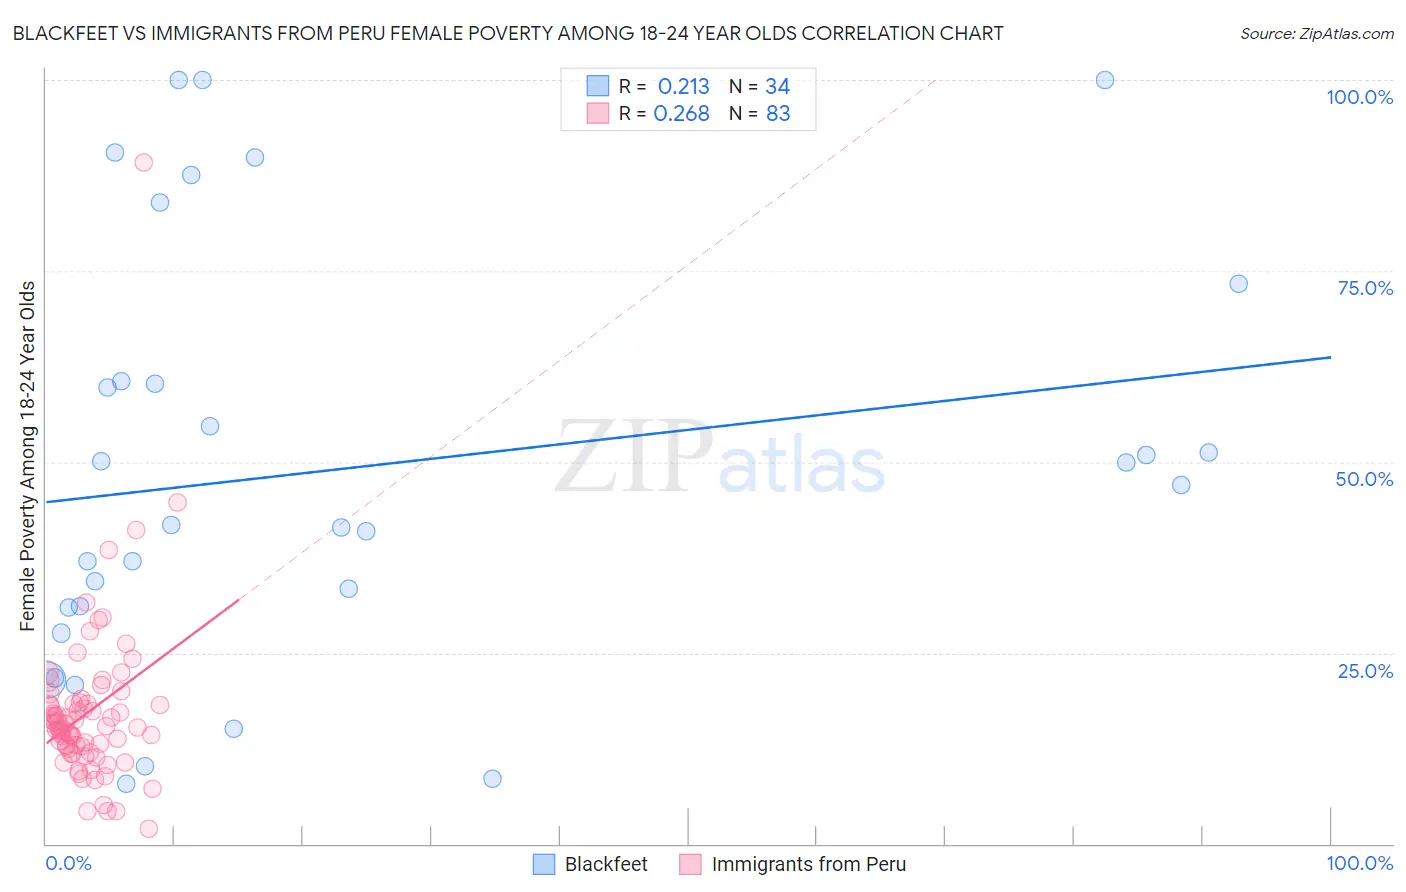
Blackfeet vs Immigrants from Peru Female Poverty Among 18-24 Year Olds Correlation Chart

The statistical analysis conducted on geographies consisting of 304,376,728 people shows a weak positive correlation between the proportion of Blackfeet and poverty level among females between the ages 18 and 24 in the United States with a correlation coefficient (R) of 0.213 and weighted average of 23.6%. Similarly, the statistical analysis conducted on geographies consisting of 322,984,963 people shows a weak positive correlation between the proportion of Immigrants from Peru and poverty level among females between the ages 18 and 24 in the United States with a correlation coefficient (R) of 0.268 and weighted average of 16.9%, a difference of 40.0%.
Blackfeet vs Immigrants from Peru Female Poverty Among 18-24 Year Olds

Female Poverty Among 18-24 Year Olds Correlation Summary

MeasurementBlackfeetImmigrants from Peru
Minimum7.9%2.0%
Maximum100.0%89.2%
Range92.1%87.2%
Mean49.1%17.2%
Median44.4%15.3%
Interquartile 25% (IQ1)31.0%12.5%
Interquartile 75% (IQ3)60.5%18.4%
Interquartile Range (IQR)29.5%5.9%
Standard Deviation (Sample)27.7%10.9%
Standard Deviation (Population)27.2%10.9%

Similar Demographics by Female Poverty Among 18-24 Year Olds

Demographics Similar to Blackfeet by Female Poverty Among 18-24 Year Olds

In terms of female poverty among 18-24 year olds, the demographic groups most similar to Blackfeet are Comanche (23.6%, a difference of 0.050%), Potawatomi (23.7%, a difference of 0.34%), Immigrants from Sudan (23.5%, a difference of 0.45%), Cree (23.4%, a difference of 0.80%), and Paiute (23.3%, a difference of 1.4%).
DemographicsRating | RankFemale Poverty Among 18-24 Year Olds
Iroquois
0.0
/100
|
#302
Tragic
22.9%
Senegalese
0.0
/100
|
#303
Tragic
23.0%
Sudanese
0.0
/100
|
#304
Tragic
23.0%
Immigrants | Kuwait
0.0
/100
|
#305
Tragic
23.0%
Paiute
0.0
/100
|
#306
Tragic
23.3%
Cree
0.0
/100
|
#307
Tragic
23.4%
Immigrants | Sudan
0.0
/100
|
#308
Tragic
23.5%
Blackfeet
0.0
/100
|
#309
Tragic
23.6%
Comanche
0.0
/100
|
#310
Tragic
23.6%
Potawatomi
0.0
/100
|
#311
Tragic
23.7%
Yuman
0.0
/100
|
#312
Tragic
24.0%
Creek
0.0
/100
|
#313
Tragic
24.2%
Choctaw
0.0
/100
|
#314
Tragic
24.3%
Blacks/African Americans
0.0
/100
|
#315
Tragic
24.3%
Alsatians
0.0
/100
|
#316
Tragic
24.4%

Demographics Similar to Immigrants from Peru by Female Poverty Among 18-24 Year Olds

In terms of female poverty among 18-24 year olds, the demographic groups most similar to Immigrants from Peru are Korean (16.9%, a difference of 0.36%), Thai (17.0%, a difference of 0.63%), Immigrants from Pakistan (17.0%, a difference of 0.72%), Immigrants from Bolivia (16.7%, a difference of 0.84%), and Immigrants from the Azores (16.7%, a difference of 1.1%).
DemographicsRating | RankFemale Poverty Among 18-24 Year Olds
Chinese
100.0
/100
|
#2
Exceptional
16.2%
Immigrants | Cuba
100.0
/100
|
#3
Exceptional
16.4%
Immigrants | India
100.0
/100
|
#4
Exceptional
16.4%
Immigrants | Portugal
100.0
/100
|
#5
Exceptional
16.5%
Immigrants | Philippines
100.0
/100
|
#6
Exceptional
16.7%
Immigrants | Azores
100.0
/100
|
#7
Exceptional
16.7%
Immigrants | Bolivia
100.0
/100
|
#8
Exceptional
16.7%
Immigrants | Peru
100.0
/100
|
#9
Exceptional
16.9%
Koreans
100.0
/100
|
#10
Exceptional
16.9%
Thais
100.0
/100
|
#11
Exceptional
17.0%
Immigrants | Pakistan
100.0
/100
|
#12
Exceptional
17.0%
Immigrants | Poland
100.0
/100
|
#13
Exceptional
17.1%
Tongans
100.0
/100
|
#14
Exceptional
17.1%
Cubans
100.0
/100
|
#15
Exceptional
17.2%
Peruvians
100.0
/100
|
#16
Exceptional
17.2%