Blackfeet vs Immigrants from Eastern Africa Family Poverty

COMPARE

Blackfeet
Race
Ancestry
AfghanAfricanAlaska NativeAlaskan AthabascanAlbanianAleutAlsatianAmericanApacheArabArapahoArgentineanArmenianAssyrian/Chaldean/SyriacAustralianAustrianBahamianBangladeshiBarbadianBasqueBelgianBelizeanBermudanBhutaneseBlackfeetBolivianBrazilianBritishBritish West IndianBulgarianBurmeseCajunCambodianCanadianCape VerdeanCarpatho RusynCelticCentral AmericanCentral American IndianCherokeeCheyenneChickasawChileanChineseChippewaChoctawColombianColvilleComancheCosta RicanCreeCreekCroatianCrowCubanCypriotCzechCzechoslovakianDanishDelawareDominicanDutchDutch West IndianEastern EuropeanEcuadorianEgyptianEnglishEstonianEthiopianEuropeanFijianFilipinoFinnishFrenchFrench American IndianFrench CanadianGermanGerman RussianGhanaianGreekGuamanian/ChamorroGuatemalanGuyaneseHaitianHmongHonduranHopiHoumaHungarianIcelanderIndian (Asian)IndonesianInupiatIranianIraqiIrishIroquoisIsraeliItalianJamaicanJapaneseJordanianKenyanKiowaKoreanLaotianLatvianLebaneseLiberianLithuanianLumbeeLuxembourgerMacedonianMalaysianMalteseMarshalleseMenomineeMexicanMexican American IndianMongolianMoroccanNative HawaiianNavajoNepaleseNew ZealanderNicaraguanNigerianNorthern EuropeanNorwegianOkinawanOsageOttawaPaiutePakistaniPalestinianPanamanianParaguayanPennsylvania GermanPeruvianPimaPolishPortuguesePotawatomiPuebloPuerto RicanPuget Sound SalishRomanianRussianSalvadoranSamoanScandinavianScotch-IrishScottishSeminoleSenegaleseSerbianShoshoneSierra LeoneanSiouxSlavicSlovakSloveneSomaliSouth AfricanSouth AmericanSouth American IndianSoviet UnionSpaniardSpanishSpanish AmericanSpanish American IndianSri LankanSubsaharan AfricanSudaneseSwedishSwissSyrianTaiwaneseThaiTlingit-HaidaTohono O'OdhamTonganTrinidadian and TobagonianTsimshianTurkishU.S. Virgin IslanderUgandanUkrainianUruguayanUteVenezuelanVietnameseWelshWest IndianYakamaYaquiYugoslavianYumanYup'ikZimbabwean
Immigration
NonimmigrantsImmigrantsAfghanistanAfricaAlbaniaArgentinaArmeniaAsiaAustraliaAustriaBahamasBangladeshBarbadosBelarusBelgiumBelizeBoliviaBosnia and HerzegovinaBrazilBulgariaBurma/MyanmarCabo VerdeCambodiaCameroonCanadaCaribbeanCentral AmericaChileChinaColombiaCongoCosta RicaCroatiaCubaCzechoslovakiaDenmarkDominicaDominican RepublicEastern AsiaEastern EuropeEcuadorEgyptEl SalvadorEnglandEritreaEthiopiaEuropeFijiFranceGermanyGhanaGreeceGrenadaGuatemalaGuyanaHaitiHondurasHong KongHungaryIndiaIndonesiaIranIraqIrelandIsraelItalyJamaicaJapanJordanKazakhstanKenyaKoreaKuwaitLaosLatin AmericaLatviaLebanonLiberiaLithuaniaMalaysiaMexicoMicronesiaMiddle AfricaMoldovaMoroccoNepalNetherlandsNicaraguaNigeriaNorth AmericaNorth MacedoniaNorthern AfricaNorthern EuropeNorwayOceaniaPakistanPanamaPeruPhilippinesPolandPortugalRomaniaRussiaSaudi ArabiaScotlandSenegalSerbiaSierra LeoneSingaporeSomaliaSouth AfricaSouth AmericaSouth Central AsiaSouth Eastern AsiaSouthern EuropeSpainSri LankaSt. Vincent and the GrenadinesSudanSwedenSwitzerlandSyriaTaiwanThailandTrinidad and TobagoTurkeyUgandaUkraineUruguayUzbekistanVenezuelaVietnamWest IndiesWestern AfricaWestern AsiaWestern EuropeYemenZaireZimbabweAzores
Immigrants from Eastern Africa
Race
Ancestry
AfghanAfricanAlaska NativeAlaskan AthabascanAlbanianAleutAlsatianAmericanApacheArabArapahoArgentineanArmenianAssyrian/Chaldean/SyriacAustralianAustrianBahamianBangladeshiBarbadianBasqueBelgianBelizeanBermudanBhutaneseBolivianBrazilianBritishBritish West IndianBulgarianBurmeseCajunCambodianCanadianCape VerdeanCarpatho RusynCelticCentral AmericanCentral American IndianCherokeeCheyenneChickasawChileanChineseChippewaChoctawColombianColvilleComancheCosta RicanCreeCreekCroatianCrowCubanCypriotCzechCzechoslovakianDanishDelawareDominicanDutchDutch West IndianEastern EuropeanEcuadorianEgyptianEnglishEstonianEthiopianEuropeanFijianFilipinoFinnishFrenchFrench American IndianFrench CanadianGermanGerman RussianGhanaianGreekGuamanian/ChamorroGuatemalanGuyaneseHaitianHmongHonduranHopiHoumaHungarianIcelanderIndian (Asian)IndonesianInupiatIranianIraqiIrishIroquoisIsraeliItalianJamaicanJapaneseJordanianKenyanKiowaKoreanLaotianLatvianLebaneseLiberianLithuanianLumbeeLuxembourgerMacedonianMalaysianMalteseMarshalleseMenomineeMexicanMexican American IndianMongolianMoroccanNative HawaiianNavajoNepaleseNew ZealanderNicaraguanNigerianNorthern EuropeanNorwegianOkinawanOsageOttawaPaiutePakistaniPalestinianPanamanianParaguayanPennsylvania GermanPeruvianPimaPolishPortuguesePotawatomiPuebloPuerto RicanPuget Sound SalishRomanianRussianSalvadoranSamoanScandinavianScotch-IrishScottishSeminoleSenegaleseSerbianShoshoneSierra LeoneanSiouxSlavicSlovakSloveneSomaliSouth AfricanSouth AmericanSouth American IndianSoviet UnionSpaniardSpanishSpanish AmericanSpanish American IndianSri LankanSubsaharan AfricanSudaneseSwedishSwissSyrianTaiwaneseThaiTlingit-HaidaTohono O'OdhamTonganTrinidadian and TobagonianTsimshianTurkishU.S. Virgin IslanderUgandanUkrainianUruguayanUteVenezuelanVietnameseWelshWest IndianYakamaYaquiYugoslavianYumanYup'ikZimbabwean
Immigration
NonimmigrantsImmigrantsAfghanistanAfricaAlbaniaArgentinaArmeniaAsiaAustraliaAustriaBahamasBangladeshBarbadosBelarusBelgiumBelizeBoliviaBosnia and HerzegovinaBrazilBulgariaBurma/MyanmarCabo VerdeCambodiaCameroonCanadaCaribbeanCentral AmericaChileChinaColombiaCongoCosta RicaCroatiaCubaCzechoslovakiaDenmarkDominicaDominican RepublicEastern AfricaEastern AsiaEastern EuropeEcuadorEgyptEl SalvadorEnglandEritreaEthiopiaEuropeFijiFranceGermanyGhanaGreeceGrenadaGuatemalaGuyanaHaitiHondurasHong KongHungaryIndiaIndonesiaIranIraqIrelandIsraelItalyJamaicaJapanJordanKazakhstanKenyaKoreaKuwaitLaosLatin AmericaLatviaLebanonLiberiaLithuaniaMalaysiaMexicoMicronesiaMiddle AfricaMoldovaMoroccoNepalNetherlandsNicaraguaNigeriaNorth AmericaNorth MacedoniaNorthern AfricaNorthern EuropeNorwayOceaniaPakistanPanamaPeruPhilippinesPolandPortugalRomaniaRussiaSaudi ArabiaScotlandSenegalSerbiaSierra LeoneSingaporeSomaliaSouth AfricaSouth AmericaSouth Central AsiaSouth Eastern AsiaSouthern EuropeSpainSri LankaSt. Vincent and the GrenadinesSudanSwedenSwitzerlandSyriaTaiwanThailandTrinidad and TobagoTurkeyUgandaUkraineUruguayUzbekistanVenezuelaVietnamWest IndiesWestern AfricaWestern AsiaWestern EuropeYemenZaireZimbabweAzores
Family Poverty
Income
Poverty
Unemployment
Labor Participation
Family Structure
Vehicle Availability
Education Level
Disability

Family Poverty Comparison

Blackfeet

Immigrants from Eastern Africa

Tragic
Poor
11.3%
FAMILY POVERTY
0.0/ 100
METRIC RATING
279th/ 347
METRIC RANK
9.5%
FAMILY POVERTY
15.1/ 100
METRIC RATING
208th/ 347
METRIC RANK

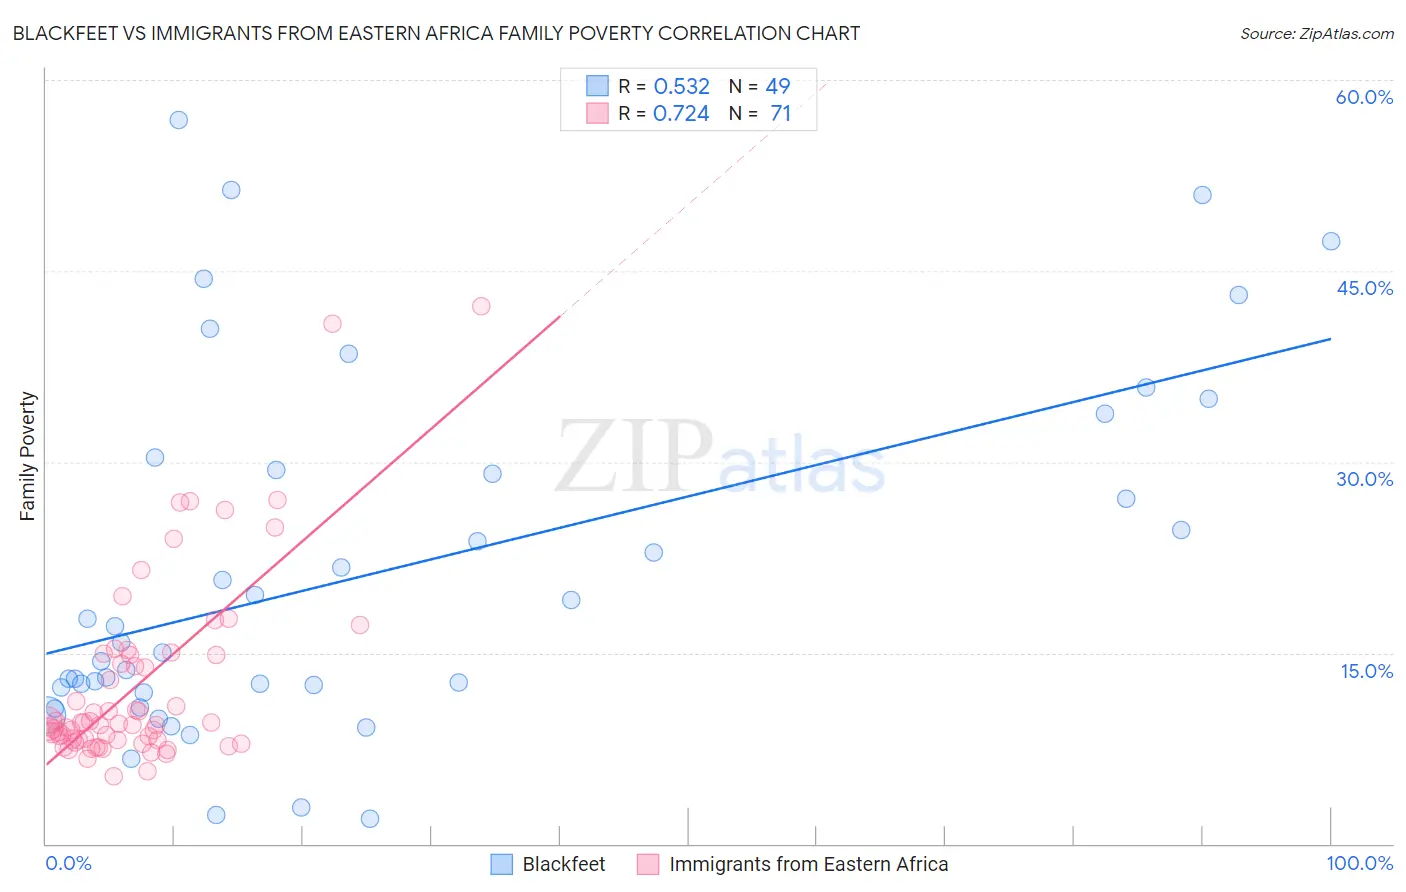
Blackfeet vs Immigrants from Eastern Africa Family Poverty Correlation Chart

The statistical analysis conducted on geographies consisting of 309,172,576 people shows a substantial positive correlation between the proportion of Blackfeet and poverty level among families in the United States with a correlation coefficient (R) of 0.532 and weighted average of 11.3%. Similarly, the statistical analysis conducted on geographies consisting of 354,301,294 people shows a strong positive correlation between the proportion of Immigrants from Eastern Africa and poverty level among families in the United States with a correlation coefficient (R) of 0.724 and weighted average of 9.5%, a difference of 18.3%.
Blackfeet vs Immigrants from Eastern Africa Family Poverty

Family Poverty Correlation Summary

MeasurementBlackfeetImmigrants from Eastern Africa
Minimum2.0%5.3%
Maximum56.9%42.2%
Range54.9%36.8%
Mean21.4%12.5%
Median15.8%9.4%
Interquartile 25% (IQ1)12.1%8.1%
Interquartile 75% (IQ3)29.9%14.9%
Interquartile Range (IQR)17.8%6.7%
Standard Deviation (Sample)14.0%7.4%
Standard Deviation (Population)13.9%7.4%

Similar Demographics by Family Poverty

Demographics Similar to Blackfeet by Family Poverty

In terms of family poverty, the demographic groups most similar to Blackfeet are Belizean (11.3%, a difference of 0.040%), Guyanese (11.2%, a difference of 0.14%), Chippewa (11.2%, a difference of 0.16%), Immigrants from Guyana (11.2%, a difference of 0.25%), and Central American (11.2%, a difference of 0.28%).
DemographicsRating | RankFamily Poverty
Immigrants | Jamaica
0.1
/100
|
#272
Tragic
11.2%
Somalis
0.1
/100
|
#273
Tragic
11.2%
Spanish Americans
0.1
/100
|
#274
Tragic
11.2%
Central Americans
0.1
/100
|
#275
Tragic
11.2%
Immigrants | Guyana
0.1
/100
|
#276
Tragic
11.2%
Chippewa
0.1
/100
|
#277
Tragic
11.2%
Guyanese
0.1
/100
|
#278
Tragic
11.2%
Blackfeet
0.0
/100
|
#279
Tragic
11.3%
Belizeans
0.0
/100
|
#280
Tragic
11.3%
Immigrants | West Indies
0.0
/100
|
#281
Tragic
11.3%
Immigrants | Cuba
0.0
/100
|
#282
Tragic
11.3%
Indonesians
0.0
/100
|
#283
Tragic
11.3%
Yaqui
0.0
/100
|
#284
Tragic
11.3%
Barbadians
0.0
/100
|
#285
Tragic
11.3%
Senegalese
0.0
/100
|
#286
Tragic
11.5%

Demographics Similar to Immigrants from Eastern Africa by Family Poverty

In terms of family poverty, the demographic groups most similar to Immigrants from Eastern Africa are Sierra Leonean (9.5%, a difference of 0.11%), Immigrants from Uruguay (9.5%, a difference of 0.29%), Immigrants from South America (9.5%, a difference of 0.64%), Aleut (9.5%, a difference of 0.65%), and Immigrants from Lebanon (9.4%, a difference of 0.84%).
DemographicsRating | RankFamily Poverty
Immigrants | Portugal
20.5
/100
|
#201
Fair
9.4%
Immigrants | Sierra Leone
19.6
/100
|
#202
Poor
9.4%
German Russians
19.4
/100
|
#203
Poor
9.4%
Immigrants | Lebanon
18.9
/100
|
#204
Poor
9.4%
Aleuts
18.0
/100
|
#205
Poor
9.5%
Immigrants | South America
18.0
/100
|
#206
Poor
9.5%
Sierra Leoneans
15.6
/100
|
#207
Poor
9.5%
Immigrants | Eastern Africa
15.1
/100
|
#208
Poor
9.5%
Immigrants | Uruguay
14.0
/100
|
#209
Poor
9.5%
Alsatians
11.3
/100
|
#210
Poor
9.6%
Malaysians
10.6
/100
|
#211
Poor
9.6%
Immigrants | Thailand
9.7
/100
|
#212
Tragic
9.7%
Osage
8.0
/100
|
#213
Tragic
9.7%
Immigrants | Micronesia
6.7
/100
|
#214
Tragic
9.8%
Immigrants | Nonimmigrants
6.7
/100
|
#215
Tragic
9.8%