Belgian vs Immigrants from Barbados Child Poverty Under the Age of 16

COMPARE

Belgian
Race
Ancestry
AfghanAfricanAlaska NativeAlaskan AthabascanAlbanianAleutAlsatianAmericanApacheArabArapahoArgentineanArmenianAssyrian/Chaldean/SyriacAustralianAustrianBahamianBangladeshiBarbadianBasqueBelgianBelizeanBermudanBhutaneseBlackfeetBolivianBrazilianBritishBritish West IndianBulgarianBurmeseCajunCambodianCanadianCape VerdeanCarpatho RusynCelticCentral AmericanCentral American IndianCherokeeCheyenneChickasawChileanChineseChippewaChoctawColombianColvilleComancheCosta RicanCreeCreekCroatianCrowCubanCypriotCzechCzechoslovakianDanishDelawareDominicanDutchDutch West IndianEastern EuropeanEcuadorianEgyptianEnglishEstonianEthiopianEuropeanFijianFilipinoFinnishFrenchFrench American IndianFrench CanadianGermanGerman RussianGhanaianGreekGuamanian/ChamorroGuatemalanGuyaneseHaitianHmongHonduranHopiHoumaHungarianIcelanderIndian (Asian)IndonesianInupiatIranianIraqiIrishIroquoisIsraeliItalianJamaicanJapaneseJordanianKenyanKiowaKoreanLaotianLatvianLebaneseLiberianLithuanianLumbeeLuxembourgerMacedonianMalaysianMalteseMarshalleseMenomineeMexicanMexican American IndianMongolianMoroccanNative HawaiianNavajoNepaleseNew ZealanderNicaraguanNigerianNorthern EuropeanNorwegianOkinawanOsageOttawaPaiutePakistaniPalestinianPanamanianParaguayanPennsylvania GermanPeruvianPimaPolishPortuguesePotawatomiPuebloPuerto RicanPuget Sound SalishRomanianRussianSalvadoranSamoanScandinavianScotch-IrishScottishSeminoleSenegaleseSerbianShoshoneSierra LeoneanSiouxSlavicSlovakSloveneSomaliSouth AfricanSouth AmericanSouth American IndianSoviet UnionSpaniardSpanishSpanish AmericanSpanish American IndianSri LankanSubsaharan AfricanSudaneseSwedishSwissSyrianTaiwaneseThaiTlingit-HaidaTohono O'OdhamTonganTrinidadian and TobagonianTsimshianTurkishU.S. Virgin IslanderUgandanUkrainianUruguayanUteVenezuelanVietnameseWelshWest IndianYakamaYaquiYugoslavianYumanYup'ikZimbabwean
Immigration
NonimmigrantsImmigrantsAfghanistanAfricaAlbaniaArgentinaArmeniaAsiaAustraliaAustriaBahamasBangladeshBelarusBelgiumBelizeBoliviaBosnia and HerzegovinaBrazilBulgariaBurma/MyanmarCabo VerdeCambodiaCameroonCanadaCaribbeanCentral AmericaChileChinaColombiaCongoCosta RicaCroatiaCubaCzechoslovakiaDenmarkDominicaDominican RepublicEastern AfricaEastern AsiaEastern EuropeEcuadorEgyptEl SalvadorEnglandEritreaEthiopiaEuropeFijiFranceGermanyGhanaGreeceGrenadaGuatemalaGuyanaHaitiHondurasHong KongHungaryIndiaIndonesiaIranIraqIrelandIsraelItalyJamaicaJapanJordanKazakhstanKenyaKoreaKuwaitLaosLatin AmericaLatviaLebanonLiberiaLithuaniaMalaysiaMexicoMicronesiaMiddle AfricaMoldovaMoroccoNepalNetherlandsNicaraguaNigeriaNorth AmericaNorth MacedoniaNorthern AfricaNorthern EuropeNorwayOceaniaPakistanPanamaPeruPhilippinesPolandPortugalRomaniaRussiaSaudi ArabiaScotlandSenegalSerbiaSierra LeoneSingaporeSomaliaSouth AfricaSouth AmericaSouth Central AsiaSouth Eastern AsiaSouthern EuropeSpainSri LankaSt. Vincent and the GrenadinesSudanSwedenSwitzerlandSyriaTaiwanThailandTrinidad and TobagoTurkeyUgandaUkraineUruguayUzbekistanVenezuelaVietnamWest IndiesWestern AfricaWestern AsiaWestern EuropeYemenZaireZimbabweAzores
Immigrants from Barbados
Race
Ancestry
AfghanAfricanAlaska NativeAlaskan AthabascanAlbanianAleutAlsatianAmericanApacheArabArapahoArgentineanArmenianAssyrian/Chaldean/SyriacAustralianAustrianBahamianBangladeshiBarbadianBasqueBelizeanBermudanBhutaneseBlackfeetBolivianBrazilianBritishBritish West IndianBulgarianBurmeseCajunCambodianCanadianCape VerdeanCarpatho RusynCelticCentral AmericanCentral American IndianCherokeeCheyenneChickasawChileanChineseChippewaChoctawColombianColvilleComancheCosta RicanCreeCreekCroatianCrowCubanCypriotCzechCzechoslovakianDanishDelawareDominicanDutchDutch West IndianEastern EuropeanEcuadorianEgyptianEnglishEstonianEthiopianEuropeanFijianFilipinoFinnishFrenchFrench American IndianFrench CanadianGermanGerman RussianGhanaianGreekGuamanian/ChamorroGuatemalanGuyaneseHaitianHmongHonduranHopiHoumaHungarianIcelanderIndian (Asian)IndonesianInupiatIranianIraqiIrishIroquoisIsraeliItalianJamaicanJapaneseJordanianKenyanKiowaKoreanLaotianLatvianLebaneseLiberianLithuanianLumbeeLuxembourgerMacedonianMalaysianMalteseMarshalleseMenomineeMexicanMexican American IndianMongolianMoroccanNative HawaiianNavajoNepaleseNew ZealanderNicaraguanNigerianNorthern EuropeanNorwegianOkinawanOsageOttawaPaiutePakistaniPalestinianPanamanianParaguayanPennsylvania GermanPeruvianPimaPolishPortuguesePotawatomiPuebloPuerto RicanPuget Sound SalishRomanianRussianSalvadoranSamoanScandinavianScotch-IrishScottishSeminoleSenegaleseSerbianShoshoneSierra LeoneanSiouxSlavicSlovakSloveneSomaliSouth AfricanSouth AmericanSouth American IndianSoviet UnionSpaniardSpanishSpanish AmericanSpanish American IndianSri LankanSubsaharan AfricanSudaneseSwedishSwissSyrianTaiwaneseThaiTlingit-HaidaTohono O'OdhamTonganTrinidadian and TobagonianTsimshianTurkishU.S. Virgin IslanderUgandanUkrainianUruguayanUteVenezuelanVietnameseWelshWest IndianYakamaYaquiYugoslavianYumanYup'ikZimbabwean
Immigration
NonimmigrantsImmigrantsAfghanistanAfricaAlbaniaArgentinaArmeniaAsiaAustraliaAustriaBahamasBangladeshBarbadosBelarusBelgiumBelizeBoliviaBosnia and HerzegovinaBrazilBulgariaBurma/MyanmarCabo VerdeCambodiaCameroonCanadaCaribbeanCentral AmericaChileChinaColombiaCongoCosta RicaCroatiaCubaCzechoslovakiaDenmarkDominicaDominican RepublicEastern AfricaEastern AsiaEastern EuropeEcuadorEgyptEl SalvadorEnglandEritreaEthiopiaEuropeFijiFranceGermanyGhanaGreeceGrenadaGuatemalaGuyanaHaitiHondurasHong KongHungaryIndiaIndonesiaIranIraqIrelandIsraelItalyJamaicaJapanJordanKazakhstanKenyaKoreaKuwaitLaosLatin AmericaLatviaLebanonLiberiaLithuaniaMalaysiaMexicoMicronesiaMiddle AfricaMoldovaMoroccoNepalNetherlandsNicaraguaNigeriaNorth AmericaNorth MacedoniaNorthern AfricaNorthern EuropeNorwayOceaniaPakistanPanamaPeruPhilippinesPolandPortugalRomaniaRussiaSaudi ArabiaScotlandSenegalSerbiaSierra LeoneSingaporeSomaliaSouth AfricaSouth AmericaSouth Central AsiaSouth Eastern AsiaSouthern EuropeSpainSri LankaSt. Vincent and the GrenadinesSudanSwedenSwitzerlandSyriaTaiwanThailandTrinidad and TobagoTurkeyUgandaUkraineUruguayUzbekistanVenezuelaVietnamWest IndiesWestern AfricaWestern AsiaWestern EuropeYemenZaireZimbabweAzores
Child Poverty Under the Age of 16
Income
Poverty
Unemployment
Labor Participation
Family Structure
Vehicle Availability
Education Level
Disability

Child Poverty Under the Age of 16 Comparison

Belgians

Immigrants from Barbados

Exceptional
Tragic
14.9%
CHILD POVERTY UNDER THE AGE OF 16
93.3/ 100
METRIC RATING
113th/ 347
METRIC RANK
19.9%
CHILD POVERTY UNDER THE AGE OF 16
0.1/ 100
METRIC RATING
275th/ 347
METRIC RANK

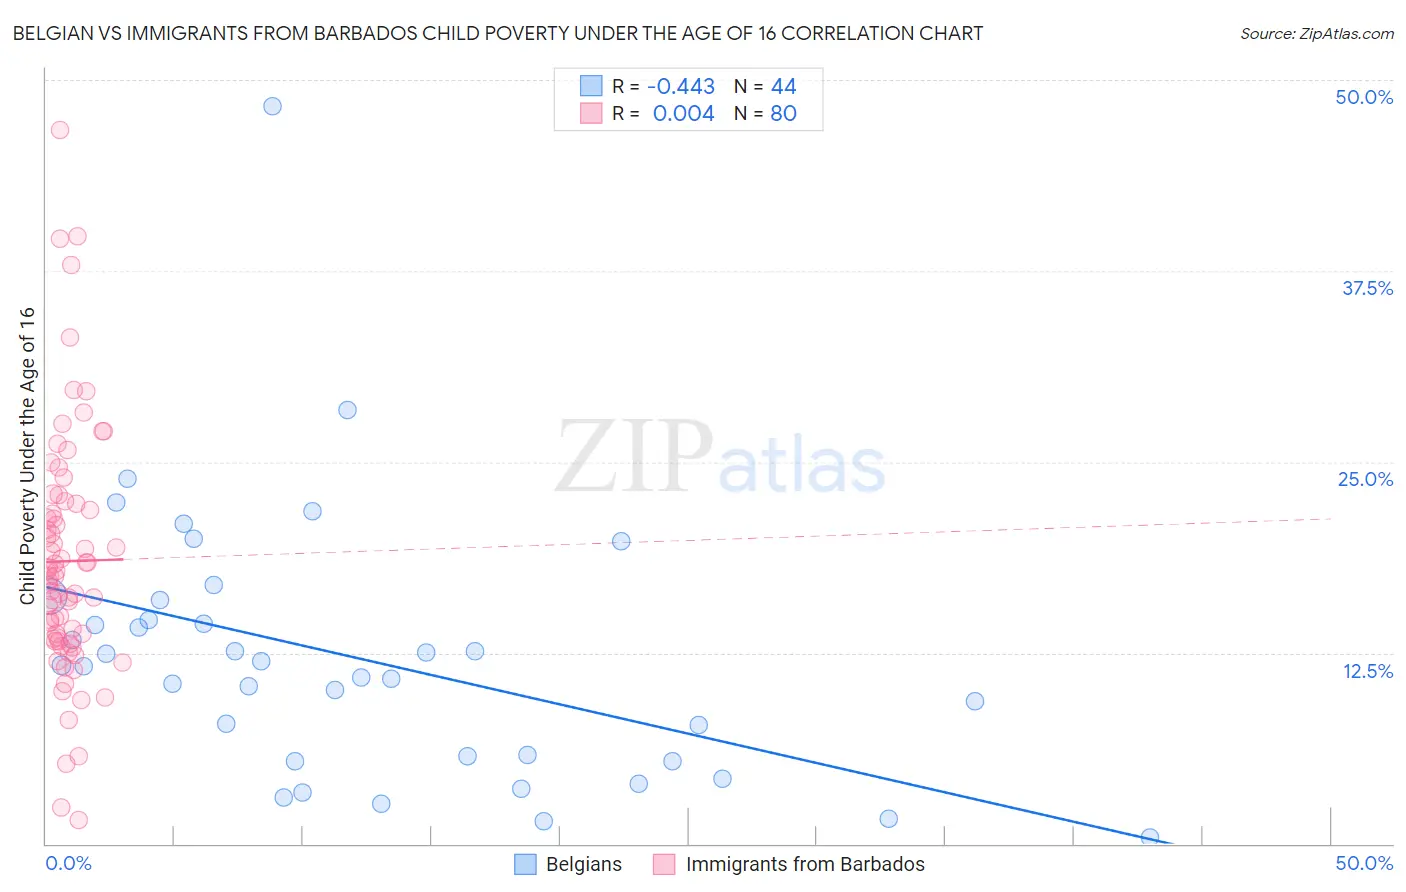
Belgian vs Immigrants from Barbados Child Poverty Under the Age of 16 Correlation Chart

The statistical analysis conducted on geographies consisting of 352,322,898 people shows a moderate negative correlation between the proportion of Belgians and poverty level among children under the age of 16 in the United States with a correlation coefficient (R) of -0.443 and weighted average of 14.9%. Similarly, the statistical analysis conducted on geographies consisting of 112,587,035 people shows no correlation between the proportion of Immigrants from Barbados and poverty level among children under the age of 16 in the United States with a correlation coefficient (R) of 0.004 and weighted average of 19.9%, a difference of 33.0%.
Belgian vs Immigrants from Barbados Child Poverty Under the Age of 16

Child Poverty Under the Age of 16 Correlation Summary

MeasurementBelgianImmigrants from Barbados
Minimum0.43%1.6%
Maximum48.3%46.7%
Range47.9%45.2%
Mean12.2%18.5%
Median11.6%17.5%
Interquartile 25% (IQ1)5.5%13.3%
Interquartile 75% (IQ3)15.3%22.0%
Interquartile Range (IQR)9.8%8.7%
Standard Deviation (Sample)8.7%8.1%
Standard Deviation (Population)8.6%8.0%

Similar Demographics by Child Poverty Under the Age of 16

Demographics Similar to Belgians by Child Poverty Under the Age of 16

In terms of child poverty under the age of 16, the demographic groups most similar to Belgians are Sri Lankan (14.9%, a difference of 0.030%), Irish (14.9%, a difference of 0.040%), Immigrants from Ukraine (14.9%, a difference of 0.090%), Immigrants from Denmark (14.9%, a difference of 0.10%), and English (14.9%, a difference of 0.11%).
DemographicsRating | RankChild Poverty Under the Age of 16
Serbians
94.5
/100
|
#106
Exceptional
14.8%
Chileans
94.4
/100
|
#107
Exceptional
14.8%
Jordanians
94.2
/100
|
#108
Exceptional
14.8%
Tlingit-Haida
94.1
/100
|
#109
Exceptional
14.9%
English
93.5
/100
|
#110
Exceptional
14.9%
Immigrants | Denmark
93.5
/100
|
#111
Exceptional
14.9%
Irish
93.4
/100
|
#112
Exceptional
14.9%
Belgians
93.3
/100
|
#113
Exceptional
14.9%
Sri Lankans
93.2
/100
|
#114
Exceptional
14.9%
Immigrants | Ukraine
93.1
/100
|
#115
Exceptional
14.9%
Carpatho Rusyns
93.1
/100
|
#116
Exceptional
14.9%
Immigrants | Norway
92.8
/100
|
#117
Exceptional
15.0%
Immigrants | Malaysia
92.6
/100
|
#118
Exceptional
15.0%
Scottish
92.3
/100
|
#119
Exceptional
15.0%
South Africans
92.1
/100
|
#120
Exceptional
15.0%

Demographics Similar to Immigrants from Barbados by Child Poverty Under the Age of 16

In terms of child poverty under the age of 16, the demographic groups most similar to Immigrants from Barbados are Immigrants from Cabo Verde (19.9%, a difference of 0.0%), Belizean (19.9%, a difference of 0.0%), Iroquois (19.9%, a difference of 0.14%), Immigrants from Jamaica (19.8%, a difference of 0.16%), and Bangladeshi (19.9%, a difference of 0.24%).
DemographicsRating | RankChild Poverty Under the Age of 16
Jamaicans
0.1
/100
|
#268
Tragic
19.7%
Immigrants | El Salvador
0.1
/100
|
#269
Tragic
19.7%
Spanish American Indians
0.1
/100
|
#270
Tragic
19.7%
Immigrants | Liberia
0.1
/100
|
#271
Tragic
19.7%
Immigrants | Bangladesh
0.1
/100
|
#272
Tragic
19.8%
Immigrants | Jamaica
0.1
/100
|
#273
Tragic
19.8%
Immigrants | Cabo Verde
0.1
/100
|
#274
Tragic
19.9%
Immigrants | Barbados
0.1
/100
|
#275
Tragic
19.9%
Belizeans
0.1
/100
|
#276
Tragic
19.9%
Iroquois
0.1
/100
|
#277
Tragic
19.9%
Bangladeshis
0.0
/100
|
#278
Tragic
19.9%
Sub-Saharan Africans
0.0
/100
|
#279
Tragic
19.9%
Comanche
0.0
/100
|
#280
Tragic
19.9%
Central Americans
0.0
/100
|
#281
Tragic
20.0%
Barbadians
0.0
/100
|
#282
Tragic
20.0%