Basque vs South African Child Poverty Under the Age of 16
COMPARE
Basque
South African
Child Poverty Under the Age of 16
Child Poverty Under the Age of 16 Comparison
Basques
South Africans
14.8%
CHILD POVERTY UNDER THE AGE OF 16
94.7/ 100
METRIC RATING
105th/ 347
METRIC RANK
15.0%
CHILD POVERTY UNDER THE AGE OF 16
92.1/ 100
METRIC RATING
120th/ 347
METRIC RANK
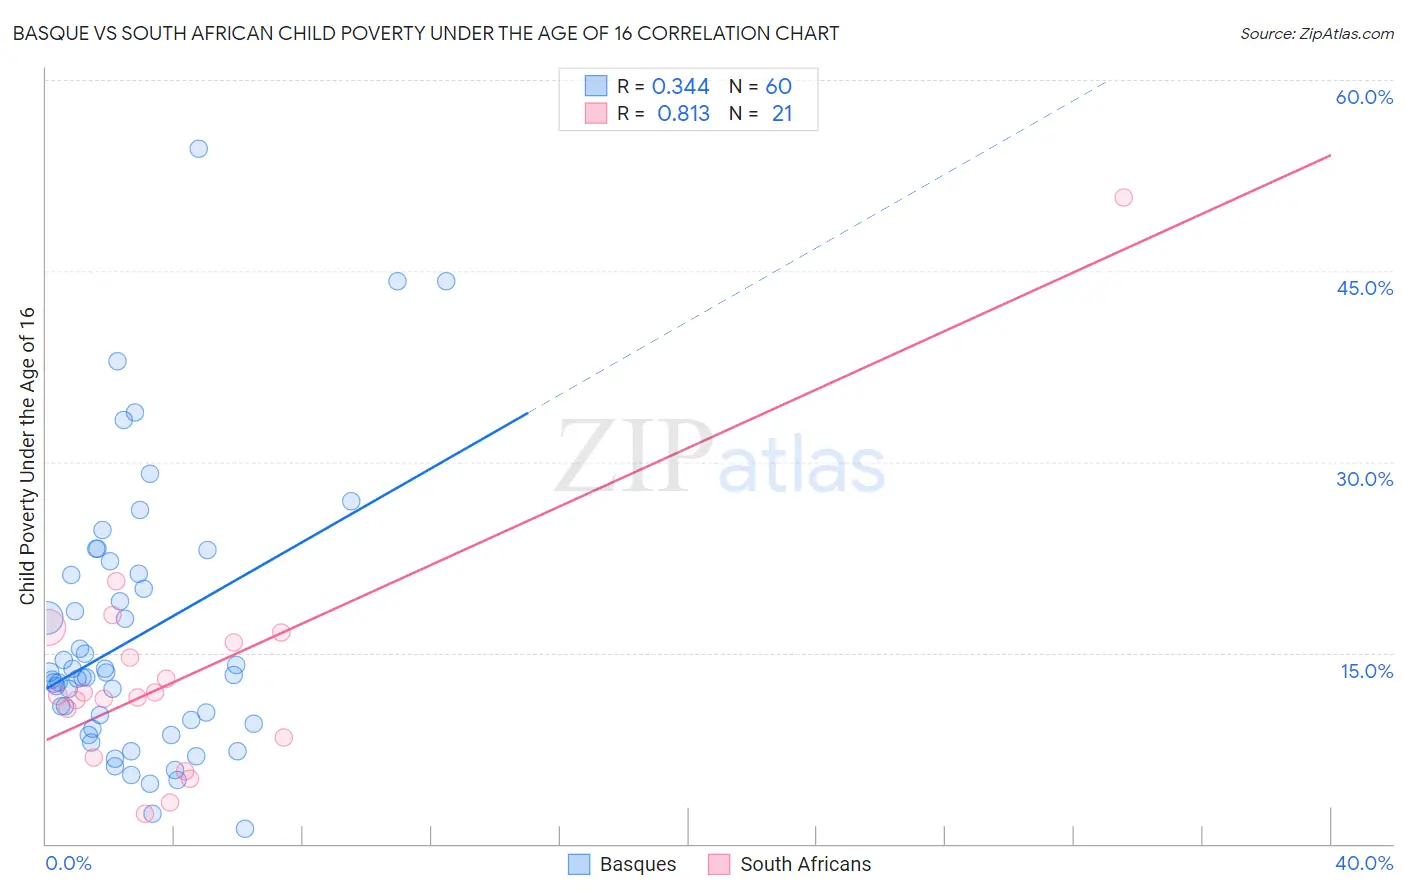
Basque vs South African Child Poverty Under the Age of 16 Correlation Chart
The statistical analysis conducted on geographies consisting of 165,163,292 people shows a mild positive correlation between the proportion of Basques and poverty level among children under the age of 16 in the United States with a correlation coefficient (R) of 0.344 and weighted average of 14.8%. Similarly, the statistical analysis conducted on geographies consisting of 181,612,100 people shows a very strong positive correlation between the proportion of South Africans and poverty level among children under the age of 16 in the United States with a correlation coefficient (R) of 0.813 and weighted average of 15.0%, a difference of 1.4%.
Child Poverty Under the Age of 16 Correlation Summary
| Measurement | Basque | South African |
| Minimum | 1.2% | 2.3% |
| Maximum | 54.6% | 50.7% |
| Range | 53.4% | 48.4% |
| Mean | 16.3% | 13.2% |
| Median | 13.2% | 11.7% |
| Interquartile 25% (IQ1) | 9.2% | 7.6% |
| Interquartile 75% (IQ3) | 21.1% | 16.2% |
| Interquartile Range (IQR) | 11.9% | 8.6% |
| Standard Deviation (Sample) | 10.7% | 9.9% |
| Standard Deviation (Population) | 10.6% | 9.6% |
Demographics Similar to Basques and South Africans by Child Poverty Under the Age of 16
In terms of child poverty under the age of 16, the demographic groups most similar to Basques are Immigrants from England (14.8%, a difference of 0.11%), Serbian (14.8%, a difference of 0.13%), Immigrants from Egypt (14.8%, a difference of 0.15%), Chilean (14.8%, a difference of 0.19%), and Romanian (14.8%, a difference of 0.20%). Similarly, the demographic groups most similar to South Africans are Immigrants from Zimbabwe (15.0%, a difference of 0.010%), Scottish (15.0%, a difference of 0.090%), Pakistani (15.0%, a difference of 0.20%), Immigrants from Malaysia (15.0%, a difference of 0.24%), and Immigrants from Norway (15.0%, a difference of 0.30%).
| Demographics | Rating | Rank | Child Poverty Under the Age of 16 |
| Romanians | 95.0 /100 | #102 | Exceptional 14.8% |
| Immigrants | Egypt | 94.9 /100 | #103 | Exceptional 14.8% |
| Immigrants | England | 94.8 /100 | #104 | Exceptional 14.8% |
| Basques | 94.7 /100 | #105 | Exceptional 14.8% |
| Serbians | 94.5 /100 | #106 | Exceptional 14.8% |
| Chileans | 94.4 /100 | #107 | Exceptional 14.8% |
| Jordanians | 94.2 /100 | #108 | Exceptional 14.8% |
| Tlingit-Haida | 94.1 /100 | #109 | Exceptional 14.9% |
| English | 93.5 /100 | #110 | Exceptional 14.9% |
| Immigrants | Denmark | 93.5 /100 | #111 | Exceptional 14.9% |
| Irish | 93.4 /100 | #112 | Exceptional 14.9% |
| Belgians | 93.3 /100 | #113 | Exceptional 14.9% |
| Sri Lankans | 93.2 /100 | #114 | Exceptional 14.9% |
| Immigrants | Ukraine | 93.1 /100 | #115 | Exceptional 14.9% |
| Carpatho Rusyns | 93.1 /100 | #116 | Exceptional 14.9% |
| Immigrants | Norway | 92.8 /100 | #117 | Exceptional 15.0% |
| Immigrants | Malaysia | 92.6 /100 | #118 | Exceptional 15.0% |
| Scottish | 92.3 /100 | #119 | Exceptional 15.0% |
| South Africans | 92.1 /100 | #120 | Exceptional 15.0% |
| Immigrants | Zimbabwe | 92.1 /100 | #121 | Exceptional 15.0% |
| Pakistanis | 91.7 /100 | #122 | Exceptional 15.0% |