Basque vs Cypriot Female Poverty Among 18-24 Year Olds
COMPARE
Basque
Cypriot
Female Poverty Among 18-24 Year Olds
Female Poverty Among 18-24 Year Olds Comparison
Basques
Cypriots
21.7%
FEMALE POVERTY AMONG 18-24 YEAR OLDS
0.2/ 100
METRIC RATING
272nd/ 347
METRIC RANK
19.3%
FEMALE POVERTY AMONG 18-24 YEAR OLDS
95.5/ 100
METRIC RATING
119th/ 347
METRIC RANK
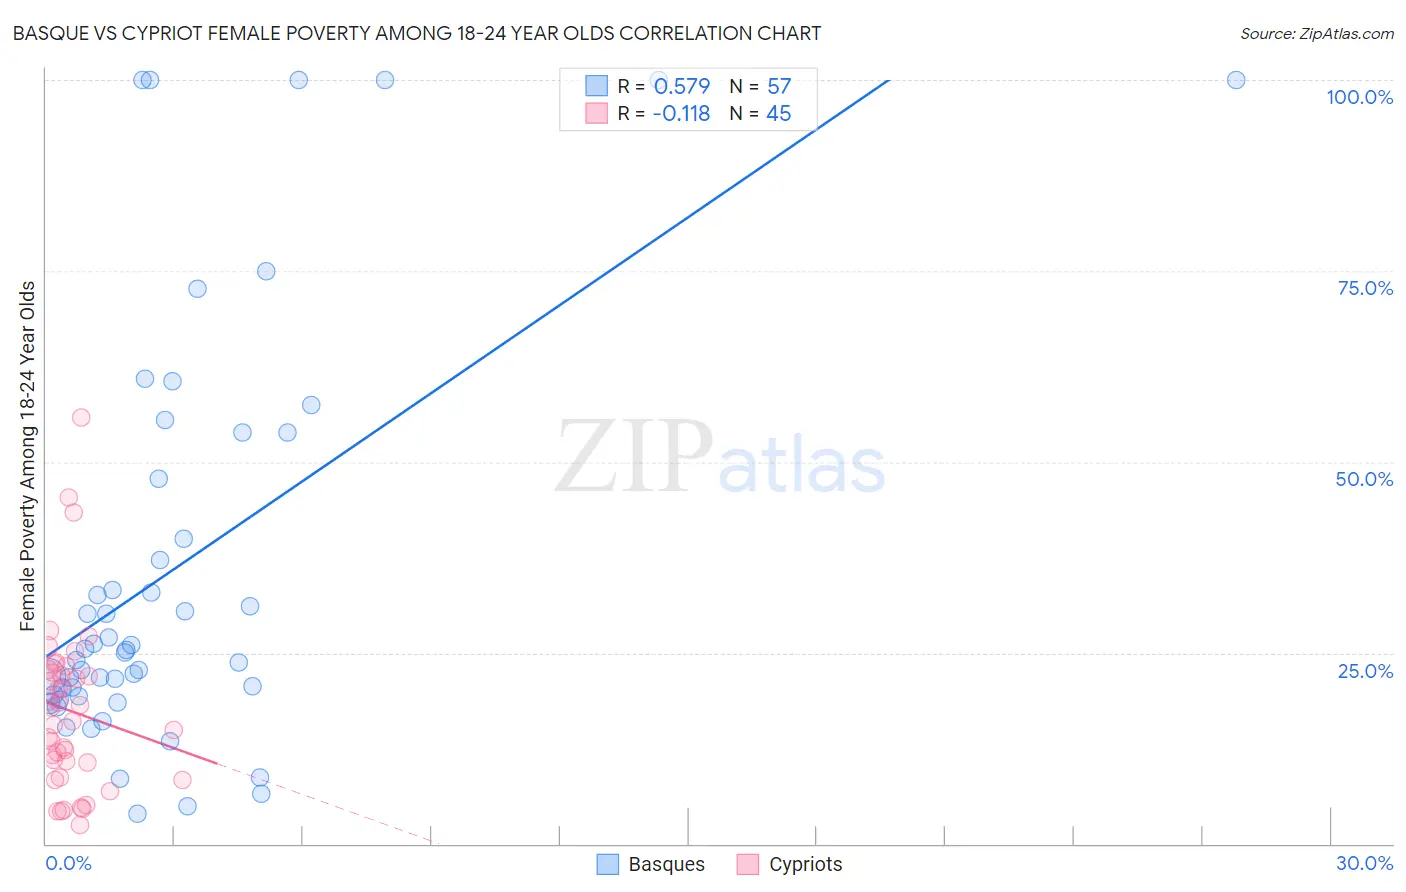
Basque vs Cypriot Female Poverty Among 18-24 Year Olds Correlation Chart
The statistical analysis conducted on geographies consisting of 164,234,087 people shows a substantial positive correlation between the proportion of Basques and poverty level among females between the ages 18 and 24 in the United States with a correlation coefficient (R) of 0.579 and weighted average of 21.7%. Similarly, the statistical analysis conducted on geographies consisting of 61,185,624 people shows a poor negative correlation between the proportion of Cypriots and poverty level among females between the ages 18 and 24 in the United States with a correlation coefficient (R) of -0.118 and weighted average of 19.3%, a difference of 12.0%.
Female Poverty Among 18-24 Year Olds Correlation Summary
| Measurement | Basque | Cypriot |
| Minimum | 4.0% | 2.5% |
| Maximum | 100.0% | 55.9% |
| Range | 96.0% | 53.4% |
| Mean | 36.1% | 17.4% |
| Median | 25.4% | 16.0% |
| Interquartile 25% (IQ1) | 19.4% | 9.7% |
| Interquartile 75% (IQ3) | 50.8% | 22.6% |
| Interquartile Range (IQR) | 31.4% | 12.9% |
| Standard Deviation (Sample) | 27.2% | 11.1% |
| Standard Deviation (Population) | 26.9% | 10.9% |
Similar Demographics by Female Poverty Among 18-24 Year Olds
Demographics Similar to Basques by Female Poverty Among 18-24 Year Olds
In terms of female poverty among 18-24 year olds, the demographic groups most similar to Basques are New Zealander (21.7%, a difference of 0.14%), Scotch-Irish (21.6%, a difference of 0.27%), Mongolian (21.6%, a difference of 0.29%), Celtic (21.6%, a difference of 0.32%), and Immigrants from Burma/Myanmar (21.6%, a difference of 0.37%).
| Demographics | Rating | Rank | Female Poverty Among 18-24 Year Olds |
| Immigrants | Nonimmigrants | 0.3 /100 | #265 | Tragic 21.5% |
| Alaska Natives | 0.3 /100 | #266 | Tragic 21.5% |
| Americans | 0.3 /100 | #267 | Tragic 21.6% |
| Immigrants | Burma/Myanmar | 0.2 /100 | #268 | Tragic 21.6% |
| Celtics | 0.2 /100 | #269 | Tragic 21.6% |
| Mongolians | 0.2 /100 | #270 | Tragic 21.6% |
| Scotch-Irish | 0.2 /100 | #271 | Tragic 21.6% |
| Basques | 0.2 /100 | #272 | Tragic 21.7% |
| New Zealanders | 0.2 /100 | #273 | Tragic 21.7% |
| Immigrants | Honduras | 0.1 /100 | #274 | Tragic 21.8% |
| Immigrants | Bangladesh | 0.1 /100 | #275 | Tragic 21.8% |
| Bahamians | 0.1 /100 | #276 | Tragic 21.8% |
| Immigrants | Switzerland | 0.1 /100 | #277 | Tragic 21.8% |
| Yaqui | 0.1 /100 | #278 | Tragic 21.9% |
| Spanish Americans | 0.1 /100 | #279 | Tragic 21.9% |
Demographics Similar to Cypriots by Female Poverty Among 18-24 Year Olds
In terms of female poverty among 18-24 year olds, the demographic groups most similar to Cypriots are Immigrants from Guyana (19.3%, a difference of 0.020%), Immigrants from Northern Europe (19.4%, a difference of 0.040%), Immigrants from Iran (19.3%, a difference of 0.070%), Guyanese (19.4%, a difference of 0.070%), and Immigrants (19.3%, a difference of 0.11%).
| Demographics | Rating | Rank | Female Poverty Among 18-24 Year Olds |
| Immigrants | El Salvador | 96.5 /100 | #112 | Exceptional 19.3% |
| Immigrants | Cameroon | 96.3 /100 | #113 | Exceptional 19.3% |
| Slovenes | 96.2 /100 | #114 | Exceptional 19.3% |
| Immigrants | Hungary | 96.2 /100 | #115 | Exceptional 19.3% |
| Immigrants | Immigrants | 95.9 /100 | #116 | Exceptional 19.3% |
| Immigrants | Iran | 95.8 /100 | #117 | Exceptional 19.3% |
| Immigrants | Guyana | 95.6 /100 | #118 | Exceptional 19.3% |
| Cypriots | 95.5 /100 | #119 | Exceptional 19.3% |
| Immigrants | Northern Europe | 95.4 /100 | #120 | Exceptional 19.4% |
| Guyanese | 95.3 /100 | #121 | Exceptional 19.4% |
| Cambodians | 94.6 /100 | #122 | Exceptional 19.4% |
| Paraguayans | 94.6 /100 | #123 | Exceptional 19.4% |
| Immigrants | Chile | 94.3 /100 | #124 | Exceptional 19.4% |
| Immigrants | Panama | 94.0 /100 | #125 | Exceptional 19.4% |
| Immigrants | Russia | 93.7 /100 | #126 | Exceptional 19.4% |