Barbadian vs Tlingit-Haida Child Poverty Among Boys Under 16
COMPARE
Barbadian
Tlingit-Haida
Child Poverty Among Boys Under 16
Child Poverty Among Boys Under 16 Comparison
Barbadians
Tlingit-Haida
20.2%
CHILD POVERTY AMONG BOYS UNDER 16
0.0/ 100
METRIC RATING
284th/ 347
METRIC RANK
15.3%
CHILD POVERTY AMONG BOYS UNDER 16
92.2/ 100
METRIC RATING
124th/ 347
METRIC RANK
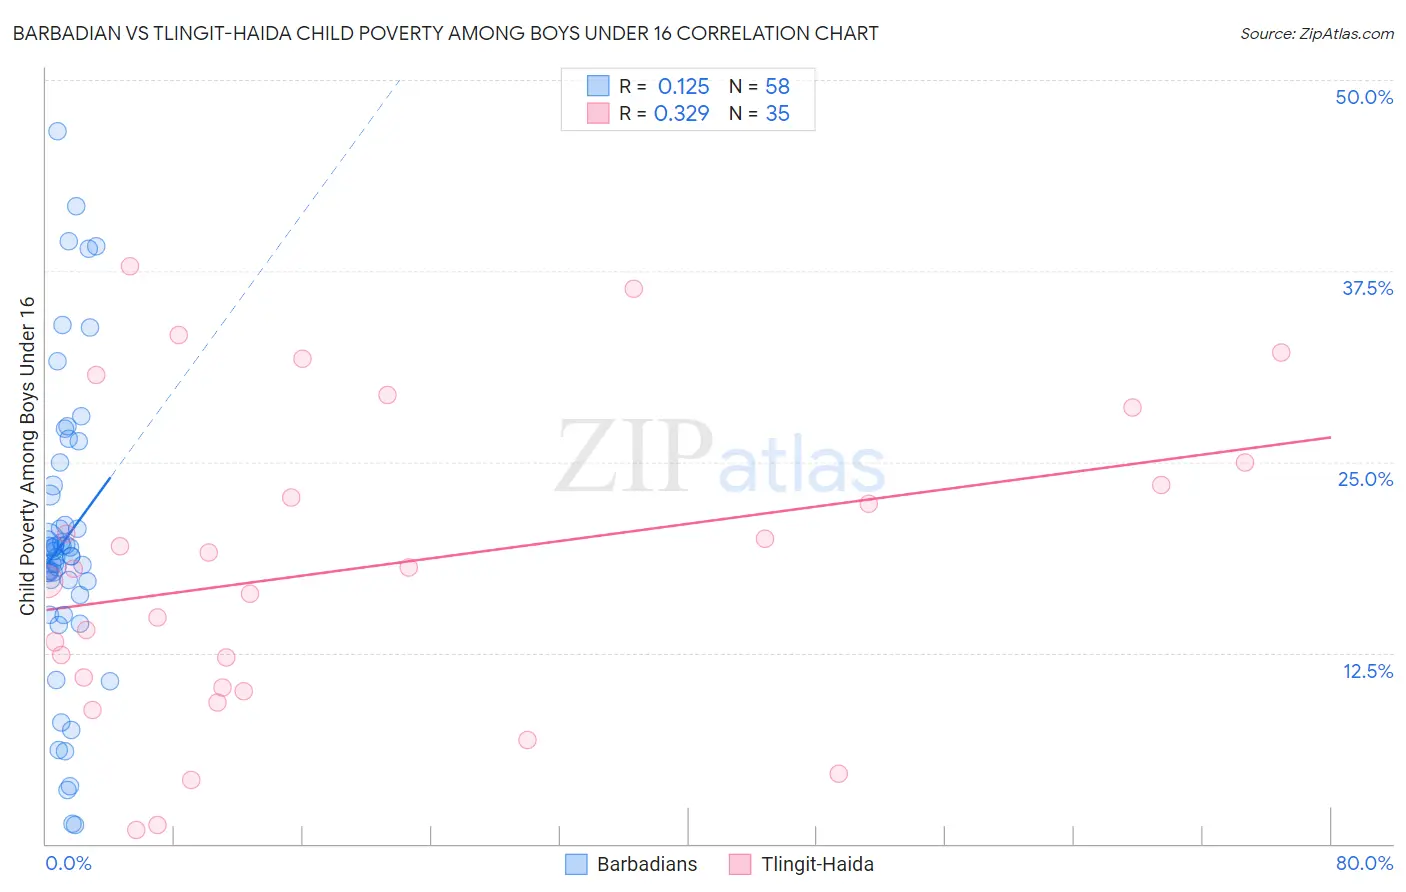
Barbadian vs Tlingit-Haida Child Poverty Among Boys Under 16 Correlation Chart
The statistical analysis conducted on geographies consisting of 140,592,540 people shows a poor positive correlation between the proportion of Barbadians and poverty level among boys under the age of 16 in the United States with a correlation coefficient (R) of 0.125 and weighted average of 20.2%. Similarly, the statistical analysis conducted on geographies consisting of 60,443,448 people shows a mild positive correlation between the proportion of Tlingit-Haida and poverty level among boys under the age of 16 in the United States with a correlation coefficient (R) of 0.329 and weighted average of 15.3%, a difference of 31.7%.
Child Poverty Among Boys Under 16 Correlation Summary
| Measurement | Barbadian | Tlingit-Haida |
| Minimum | 1.2% | 0.92% |
| Maximum | 46.6% | 37.8% |
| Range | 45.4% | 36.9% |
| Mean | 19.9% | 18.1% |
| Median | 19.0% | 18.0% |
| Interquartile 25% (IQ1) | 16.3% | 10.2% |
| Interquartile 75% (IQ3) | 23.5% | 25.0% |
| Interquartile Range (IQR) | 7.2% | 14.8% |
| Standard Deviation (Sample) | 9.7% | 10.0% |
| Standard Deviation (Population) | 9.6% | 9.9% |
Similar Demographics by Child Poverty Among Boys Under 16
Demographics Similar to Barbadians by Child Poverty Among Boys Under 16
In terms of child poverty among boys under 16, the demographic groups most similar to Barbadians are Arapaho (20.2%, a difference of 0.15%), Immigrants from Jamaica (20.1%, a difference of 0.23%), Comanche (20.1%, a difference of 0.36%), Immigrants from Zaire (20.1%, a difference of 0.41%), and Central American (20.1%, a difference of 0.47%).
| Demographics | Rating | Rank | Child Poverty Among Boys Under 16 |
| Immigrants | Barbados | 0.0 /100 | #277 | Tragic 20.0% |
| Immigrants | West Indies | 0.0 /100 | #278 | Tragic 20.0% |
| Bangladeshis | 0.0 /100 | #279 | Tragic 20.0% |
| Central Americans | 0.0 /100 | #280 | Tragic 20.1% |
| Immigrants | Zaire | 0.0 /100 | #281 | Tragic 20.1% |
| Comanche | 0.0 /100 | #282 | Tragic 20.1% |
| Immigrants | Jamaica | 0.0 /100 | #283 | Tragic 20.1% |
| Barbadians | 0.0 /100 | #284 | Tragic 20.2% |
| Arapaho | 0.0 /100 | #285 | Tragic 20.2% |
| West Indians | 0.0 /100 | #286 | Tragic 20.3% |
| Immigrants | Belize | 0.0 /100 | #287 | Tragic 20.3% |
| Immigrants | St. Vincent and the Grenadines | 0.0 /100 | #288 | Tragic 20.3% |
| Blackfeet | 0.0 /100 | #289 | Tragic 20.4% |
| Senegalese | 0.0 /100 | #290 | Tragic 20.6% |
| Immigrants | Latin America | 0.0 /100 | #291 | Tragic 20.6% |
Demographics Similar to Tlingit-Haida by Child Poverty Among Boys Under 16
In terms of child poverty among boys under 16, the demographic groups most similar to Tlingit-Haida are Immigrants from Norway (15.3%, a difference of 0.010%), Czechoslovakian (15.3%, a difference of 0.070%), Immigrants from Malaysia (15.3%, a difference of 0.23%), Scottish (15.2%, a difference of 0.33%), and South African (15.2%, a difference of 0.34%).
| Demographics | Rating | Rank | Child Poverty Among Boys Under 16 |
| Immigrants | Vietnam | 93.5 /100 | #117 | Exceptional 15.2% |
| Native Hawaiians | 93.4 /100 | #118 | Exceptional 15.2% |
| Belgians | 93.1 /100 | #119 | Exceptional 15.2% |
| South Africans | 93.0 /100 | #120 | Exceptional 15.2% |
| Scottish | 93.0 /100 | #121 | Exceptional 15.2% |
| Immigrants | Malaysia | 92.8 /100 | #122 | Exceptional 15.3% |
| Immigrants | Norway | 92.3 /100 | #123 | Exceptional 15.3% |
| Tlingit-Haida | 92.2 /100 | #124 | Exceptional 15.3% |
| Czechoslovakians | 92.1 /100 | #125 | Exceptional 15.3% |
| Palestinians | 91.3 /100 | #126 | Exceptional 15.4% |
| Carpatho Rusyns | 91.1 /100 | #127 | Exceptional 15.4% |
| Canadians | 90.6 /100 | #128 | Exceptional 15.4% |
| Immigrants | Brazil | 90.3 /100 | #129 | Exceptional 15.4% |
| Mongolians | 90.2 /100 | #130 | Exceptional 15.4% |
| Immigrants | Western Europe | 90.0 /100 | #131 | Exceptional 15.4% |