Barbadian vs Kiowa Female Poverty Among 18-24 Year Olds
COMPARE
Barbadian
Kiowa
Female Poverty Among 18-24 Year Olds
Female Poverty Among 18-24 Year Olds Comparison
Barbadians
Kiowa
20.7%
FEMALE POVERTY AMONG 18-24 YEAR OLDS
9.0/ 100
METRIC RATING
221st/ 347
METRIC RANK
29.2%
FEMALE POVERTY AMONG 18-24 YEAR OLDS
0.0/ 100
METRIC RATING
342nd/ 347
METRIC RANK
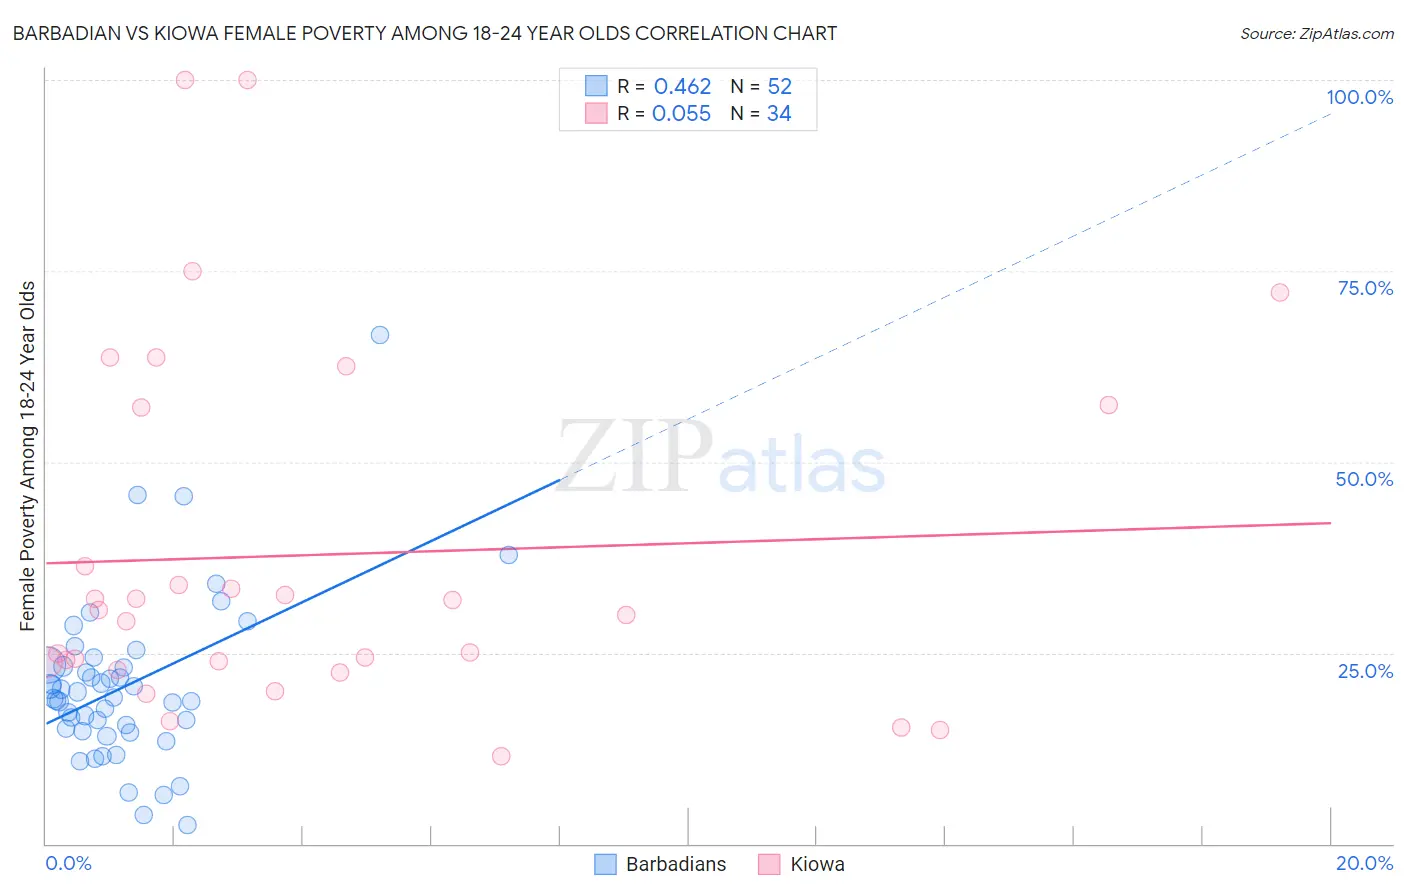
Barbadian vs Kiowa Female Poverty Among 18-24 Year Olds Correlation Chart
The statistical analysis conducted on geographies consisting of 140,037,273 people shows a moderate positive correlation between the proportion of Barbadians and poverty level among females between the ages 18 and 24 in the United States with a correlation coefficient (R) of 0.462 and weighted average of 20.7%. Similarly, the statistical analysis conducted on geographies consisting of 55,937,345 people shows a slight positive correlation between the proportion of Kiowa and poverty level among females between the ages 18 and 24 in the United States with a correlation coefficient (R) of 0.055 and weighted average of 29.2%, a difference of 41.4%.
Female Poverty Among 18-24 Year Olds Correlation Summary
| Measurement | Barbadian | Kiowa |
| Minimum | 2.5% | 11.5% |
| Maximum | 66.7% | 100.0% |
| Range | 64.2% | 88.5% |
| Mean | 20.7% | 37.8% |
| Median | 19.1% | 30.3% |
| Interquartile 25% (IQ1) | 14.9% | 23.8% |
| Interquartile 75% (IQ3) | 23.4% | 57.1% |
| Interquartile Range (IQR) | 8.5% | 33.3% |
| Standard Deviation (Sample) | 11.0% | 23.3% |
| Standard Deviation (Population) | 10.9% | 23.0% |
Similar Demographics by Female Poverty Among 18-24 Year Olds
Demographics Similar to Barbadians by Female Poverty Among 18-24 Year Olds
In terms of female poverty among 18-24 year olds, the demographic groups most similar to Barbadians are British (20.7%, a difference of 0.070%), Immigrants from Micronesia (20.7%, a difference of 0.090%), Immigrants from Nepal (20.7%, a difference of 0.10%), Immigrants from Laos (20.6%, a difference of 0.11%), and Guatemalan (20.7%, a difference of 0.14%).
| Demographics | Rating | Rank | Female Poverty Among 18-24 Year Olds |
| Immigrants | South Africa | 10.7 /100 | #214 | Poor 20.6% |
| Spanish | 10.4 /100 | #215 | Poor 20.6% |
| Immigrants | Western Africa | 10.2 /100 | #216 | Poor 20.6% |
| Immigrants | Laos | 9.7 /100 | #217 | Tragic 20.6% |
| Immigrants | Nepal | 9.6 /100 | #218 | Tragic 20.7% |
| Immigrants | Micronesia | 9.6 /100 | #219 | Tragic 20.7% |
| British | 9.4 /100 | #220 | Tragic 20.7% |
| Barbadians | 9.0 /100 | #221 | Tragic 20.7% |
| Guatemalans | 8.1 /100 | #222 | Tragic 20.7% |
| French | 7.9 /100 | #223 | Tragic 20.7% |
| Immigrants | Liberia | 7.6 /100 | #224 | Tragic 20.7% |
| Norwegians | 7.3 /100 | #225 | Tragic 20.7% |
| Estonians | 7.2 /100 | #226 | Tragic 20.7% |
| Immigrants | Sweden | 6.8 /100 | #227 | Tragic 20.7% |
| Ghanaians | 6.5 /100 | #228 | Tragic 20.8% |
Demographics Similar to Kiowa by Female Poverty Among 18-24 Year Olds
In terms of female poverty among 18-24 year olds, the demographic groups most similar to Kiowa are Colville (29.0%, a difference of 0.74%), Puerto Rican (29.8%, a difference of 2.1%), Sioux (28.6%, a difference of 2.3%), Pima (28.4%, a difference of 2.9%), and Hopi (28.2%, a difference of 3.6%).
| Demographics | Rating | Rank | Female Poverty Among 18-24 Year Olds |
| Apache | 0.0 /100 | #333 | Tragic 26.3% |
| Pueblo | 0.0 /100 | #334 | Tragic 26.9% |
| Yup'ik | 0.0 /100 | #335 | Tragic 27.0% |
| Immigrants | Yemen | 0.0 /100 | #336 | Tragic 27.5% |
| Cheyenne | 0.0 /100 | #337 | Tragic 28.1% |
| Hopi | 0.0 /100 | #338 | Tragic 28.2% |
| Pima | 0.0 /100 | #339 | Tragic 28.4% |
| Sioux | 0.0 /100 | #340 | Tragic 28.6% |
| Colville | 0.0 /100 | #341 | Tragic 29.0% |
| Kiowa | 0.0 /100 | #342 | Tragic 29.2% |
| Puerto Ricans | 0.0 /100 | #343 | Tragic 29.8% |
| Navajo | 0.0 /100 | #344 | Tragic 30.3% |
| Tohono O'odham | 0.0 /100 | #345 | Tragic 31.0% |
| Lumbee | 0.0 /100 | #346 | Tragic 31.1% |
| Crow | 0.0 /100 | #347 | Tragic 33.2% |