Bahamian vs South American Indian Male Poverty
COMPARE
Bahamian
South American Indian
Male Poverty
Male Poverty Comparison
Bahamians
South American Indians
14.1%
MALE POVERTY
0.0/ 100
METRIC RATING
303rd/ 347
METRIC RANK
11.5%
MALE POVERTY
22.8/ 100
METRIC RATING
191st/ 347
METRIC RANK
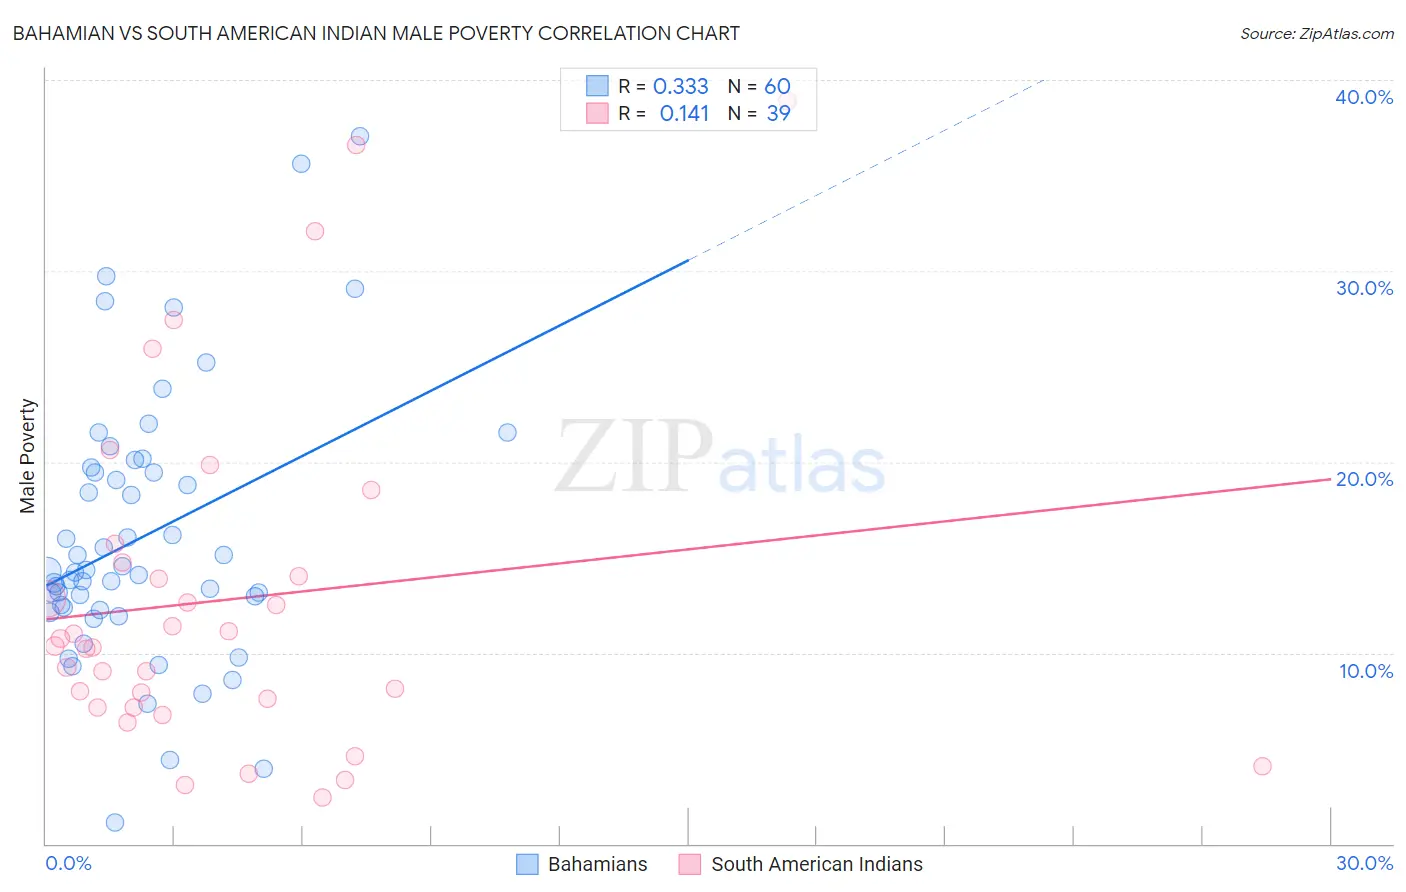
Bahamian vs South American Indian Male Poverty Correlation Chart
The statistical analysis conducted on geographies consisting of 112,626,809 people shows a mild positive correlation between the proportion of Bahamians and poverty level among males in the United States with a correlation coefficient (R) of 0.333 and weighted average of 14.1%. Similarly, the statistical analysis conducted on geographies consisting of 164,512,423 people shows a poor positive correlation between the proportion of South American Indians and poverty level among males in the United States with a correlation coefficient (R) of 0.141 and weighted average of 11.5%, a difference of 22.0%.
Male Poverty Correlation Summary
| Measurement | Bahamian | South American Indian |
| Minimum | 1.1% | 2.4% |
| Maximum | 37.0% | 38.9% |
| Range | 35.9% | 36.5% |
| Mean | 16.1% | 12.8% |
| Median | 14.3% | 10.3% |
| Interquartile 25% (IQ1) | 12.3% | 7.1% |
| Interquartile 75% (IQ3) | 19.6% | 14.7% |
| Interquartile Range (IQR) | 7.3% | 7.6% |
| Standard Deviation (Sample) | 7.1% | 8.9% |
| Standard Deviation (Population) | 7.0% | 8.8% |
Similar Demographics by Male Poverty
Demographics Similar to Bahamians by Male Poverty
In terms of male poverty, the demographic groups most similar to Bahamians are Immigrants from Caribbean (14.0%, a difference of 0.040%), Immigrants from Senegal (14.0%, a difference of 0.10%), Senegalese (14.1%, a difference of 0.10%), Immigrants from Mexico (14.0%, a difference of 0.17%), and Immigrants from Guatemala (14.0%, a difference of 0.28%).
| Demographics | Rating | Rank | Male Poverty |
| Cajuns | 0.0 /100 | #296 | Tragic 13.9% |
| Inupiat | 0.0 /100 | #297 | Tragic 14.0% |
| Blackfeet | 0.0 /100 | #298 | Tragic 14.0% |
| Immigrants | Guatemala | 0.0 /100 | #299 | Tragic 14.0% |
| Immigrants | Mexico | 0.0 /100 | #300 | Tragic 14.0% |
| Immigrants | Senegal | 0.0 /100 | #301 | Tragic 14.0% |
| Immigrants | Caribbean | 0.0 /100 | #302 | Tragic 14.0% |
| Bahamians | 0.0 /100 | #303 | Tragic 14.1% |
| Senegalese | 0.0 /100 | #304 | Tragic 14.1% |
| Immigrants | Bangladesh | 0.0 /100 | #305 | Tragic 14.1% |
| Creek | 0.0 /100 | #306 | Tragic 14.1% |
| Dutch West Indians | 0.0 /100 | #307 | Tragic 14.2% |
| Africans | 0.0 /100 | #308 | Tragic 14.2% |
| Somalis | 0.0 /100 | #309 | Tragic 14.3% |
| Seminole | 0.0 /100 | #310 | Tragic 14.3% |
Demographics Similar to South American Indians by Male Poverty
In terms of male poverty, the demographic groups most similar to South American Indians are Israeli (11.5%, a difference of 0.43%), Immigrants from Uruguay (11.6%, a difference of 0.52%), Hawaiian (11.4%, a difference of 0.70%), Immigrants from Kuwait (11.6%, a difference of 0.81%), and Sierra Leonean (11.4%, a difference of 0.88%).
| Demographics | Rating | Rank | Male Poverty |
| Immigrants | South America | 36.9 /100 | #184 | Fair 11.3% |
| Immigrants | Afghanistan | 33.3 /100 | #185 | Fair 11.4% |
| Immigrants | Sierra Leone | 32.9 /100 | #186 | Fair 11.4% |
| Immigrants | Iraq | 31.9 /100 | #187 | Fair 11.4% |
| Sierra Leoneans | 29.9 /100 | #188 | Fair 11.4% |
| Hawaiians | 28.3 /100 | #189 | Fair 11.4% |
| Israelis | 26.1 /100 | #190 | Fair 11.5% |
| South American Indians | 22.8 /100 | #191 | Fair 11.5% |
| Immigrants | Uruguay | 19.1 /100 | #192 | Poor 11.6% |
| Immigrants | Kuwait | 17.3 /100 | #193 | Poor 11.6% |
| Immigrants | Kenya | 16.1 /100 | #194 | Poor 11.6% |
| Arabs | 15.8 /100 | #195 | Poor 11.6% |
| Hmong | 15.8 /100 | #196 | Poor 11.6% |
| Delaware | 15.4 /100 | #197 | Poor 11.7% |
| Iraqis | 14.7 /100 | #198 | Poor 11.7% |