Bahamian vs Immigrants from Northern Africa Seniors Poverty Over the Age of 65

COMPARE

Bahamian
Race
Ancestry
AfghanAfricanAlaska NativeAlaskan AthabascanAlbanianAleutAlsatianAmericanApacheArabArapahoArgentineanArmenianAssyrian/Chaldean/SyriacAustralianAustrianBahamianBangladeshiBarbadianBasqueBelgianBelizeanBermudanBhutaneseBlackfeetBolivianBrazilianBritishBritish West IndianBulgarianBurmeseCajunCambodianCanadianCape VerdeanCarpatho RusynCelticCentral AmericanCentral American IndianCherokeeCheyenneChickasawChileanChineseChippewaChoctawColombianColvilleComancheCosta RicanCreeCreekCroatianCrowCubanCypriotCzechCzechoslovakianDanishDelawareDominicanDutchDutch West IndianEastern EuropeanEcuadorianEgyptianEnglishEstonianEthiopianEuropeanFijianFilipinoFinnishFrenchFrench American IndianFrench CanadianGermanGerman RussianGhanaianGreekGuamanian/ChamorroGuatemalanGuyaneseHaitianHmongHonduranHopiHoumaHungarianIcelanderIndian (Asian)IndonesianInupiatIranianIraqiIrishIroquoisIsraeliItalianJamaicanJapaneseJordanianKenyanKiowaKoreanLaotianLatvianLebaneseLiberianLithuanianLumbeeLuxembourgerMacedonianMalaysianMalteseMarshalleseMenomineeMexicanMexican American IndianMongolianMoroccanNative HawaiianNavajoNepaleseNew ZealanderNicaraguanNigerianNorthern EuropeanNorwegianOkinawanOsageOttawaPaiutePakistaniPalestinianPanamanianParaguayanPennsylvania GermanPeruvianPimaPolishPortuguesePotawatomiPuebloPuerto RicanPuget Sound SalishRomanianRussianSalvadoranSamoanScandinavianScotch-IrishScottishSeminoleSenegaleseSerbianShoshoneSierra LeoneanSiouxSlavicSlovakSloveneSomaliSouth AfricanSouth AmericanSouth American IndianSoviet UnionSpaniardSpanishSpanish AmericanSpanish American IndianSri LankanSubsaharan AfricanSudaneseSwedishSwissSyrianTaiwaneseThaiTlingit-HaidaTohono O'OdhamTonganTrinidadian and TobagonianTsimshianTurkishU.S. Virgin IslanderUgandanUkrainianUruguayanUteVenezuelanVietnameseWelshWest IndianYakamaYaquiYugoslavianYumanYup'ikZimbabwean
Immigration
NonimmigrantsImmigrantsAfghanistanAfricaAlbaniaArgentinaArmeniaAsiaAustraliaAustriaBahamasBangladeshBarbadosBelarusBelgiumBelizeBoliviaBosnia and HerzegovinaBrazilBulgariaBurma/MyanmarCabo VerdeCambodiaCameroonCanadaCaribbeanCentral AmericaChileChinaColombiaCongoCosta RicaCroatiaCubaCzechoslovakiaDenmarkDominicaDominican RepublicEastern AfricaEastern AsiaEastern EuropeEcuadorEgyptEl SalvadorEnglandEritreaEthiopiaEuropeFijiFranceGermanyGhanaGreeceGrenadaGuatemalaGuyanaHaitiHondurasHong KongHungaryIndiaIndonesiaIranIraqIrelandIsraelItalyJamaicaJapanJordanKazakhstanKenyaKoreaKuwaitLaosLatin AmericaLatviaLebanonLiberiaLithuaniaMalaysiaMexicoMicronesiaMiddle AfricaMoldovaMoroccoNepalNetherlandsNicaraguaNigeriaNorth AmericaNorth MacedoniaNorthern EuropeNorwayOceaniaPakistanPanamaPeruPhilippinesPolandPortugalRomaniaRussiaSaudi ArabiaScotlandSenegalSerbiaSierra LeoneSingaporeSomaliaSouth AfricaSouth AmericaSouth Central AsiaSouth Eastern AsiaSouthern EuropeSpainSri LankaSt. Vincent and the GrenadinesSudanSwedenSwitzerlandSyriaTaiwanThailandTrinidad and TobagoTurkeyUgandaUkraineUruguayUzbekistanVenezuelaVietnamWest IndiesWestern AfricaWestern AsiaWestern EuropeYemenZaireZimbabweAzores
Immigrants from Northern Africa
Race
Ancestry
AfghanAfricanAlaska NativeAlaskan AthabascanAlbanianAleutAlsatianAmericanApacheArabArapahoArgentineanArmenianAssyrian/Chaldean/SyriacAustralianAustrianBangladeshiBarbadianBasqueBelgianBelizeanBermudanBhutaneseBlackfeetBolivianBrazilianBritishBritish West IndianBulgarianBurmeseCajunCambodianCanadianCape VerdeanCarpatho RusynCelticCentral AmericanCentral American IndianCherokeeCheyenneChickasawChileanChineseChippewaChoctawColombianColvilleComancheCosta RicanCreeCreekCroatianCrowCubanCypriotCzechCzechoslovakianDanishDelawareDominicanDutchDutch West IndianEastern EuropeanEcuadorianEgyptianEnglishEstonianEthiopianEuropeanFijianFilipinoFinnishFrenchFrench American IndianFrench CanadianGermanGerman RussianGhanaianGreekGuamanian/ChamorroGuatemalanGuyaneseHaitianHmongHonduranHopiHoumaHungarianIcelanderIndian (Asian)IndonesianInupiatIranianIraqiIrishIroquoisIsraeliItalianJamaicanJapaneseJordanianKenyanKiowaKoreanLaotianLatvianLebaneseLiberianLithuanianLumbeeLuxembourgerMacedonianMalaysianMalteseMarshalleseMenomineeMexicanMexican American IndianMongolianMoroccanNative HawaiianNavajoNepaleseNew ZealanderNicaraguanNigerianNorthern EuropeanNorwegianOkinawanOsageOttawaPaiutePakistaniPalestinianPanamanianParaguayanPennsylvania GermanPeruvianPimaPolishPortuguesePotawatomiPuebloPuerto RicanPuget Sound SalishRomanianRussianSalvadoranSamoanScandinavianScotch-IrishScottishSeminoleSenegaleseSerbianShoshoneSierra LeoneanSiouxSlavicSlovakSloveneSomaliSouth AfricanSouth AmericanSouth American IndianSoviet UnionSpaniardSpanishSpanish AmericanSpanish American IndianSri LankanSubsaharan AfricanSudaneseSwedishSwissSyrianTaiwaneseThaiTlingit-HaidaTohono O'OdhamTonganTrinidadian and TobagonianTsimshianTurkishU.S. Virgin IslanderUgandanUkrainianUruguayanUteVenezuelanVietnameseWelshWest IndianYakamaYaquiYugoslavianYumanYup'ikZimbabwean
Immigration
NonimmigrantsImmigrantsAfghanistanAfricaAlbaniaArgentinaArmeniaAsiaAustraliaAustriaBahamasBangladeshBarbadosBelarusBelgiumBelizeBoliviaBosnia and HerzegovinaBrazilBulgariaBurma/MyanmarCabo VerdeCambodiaCameroonCanadaCaribbeanCentral AmericaChileChinaColombiaCongoCosta RicaCroatiaCubaCzechoslovakiaDenmarkDominicaDominican RepublicEastern AfricaEastern AsiaEastern EuropeEcuadorEgyptEl SalvadorEnglandEritreaEthiopiaEuropeFijiFranceGermanyGhanaGreeceGrenadaGuatemalaGuyanaHaitiHondurasHong KongHungaryIndiaIndonesiaIranIraqIrelandIsraelItalyJamaicaJapanJordanKazakhstanKenyaKoreaKuwaitLaosLatin AmericaLatviaLebanonLiberiaLithuaniaMalaysiaMexicoMicronesiaMiddle AfricaMoldovaMoroccoNepalNetherlandsNicaraguaNigeriaNorth AmericaNorth MacedoniaNorthern AfricaNorthern EuropeNorwayOceaniaPakistanPanamaPeruPhilippinesPolandPortugalRomaniaRussiaSaudi ArabiaScotlandSenegalSerbiaSierra LeoneSingaporeSomaliaSouth AfricaSouth AmericaSouth Central AsiaSouth Eastern AsiaSouthern EuropeSpainSri LankaSt. Vincent and the GrenadinesSudanSwedenSwitzerlandSyriaTaiwanThailandTrinidad and TobagoTurkeyUgandaUkraineUruguayUzbekistanVenezuelaVietnamWest IndiesWestern AfricaWestern AsiaWestern EuropeYemenZaireZimbabweAzores
Seniors Poverty Over the Age of 65
Income
Poverty
Unemployment
Labor Participation
Family Structure
Vehicle Availability
Education Level
Disability

Seniors Poverty Over the Age of 65 Comparison

Bahamians

Immigrants from Northern Africa

Tragic
Average
14.2%
SENIORS POVERTY OVER THE AGE OF 65
0.0/ 100
METRIC RATING
310th/ 347
METRIC RANK
11.0%
SENIORS POVERTY OVER THE AGE OF 65
44.6/ 100
METRIC RATING
179th/ 347
METRIC RANK

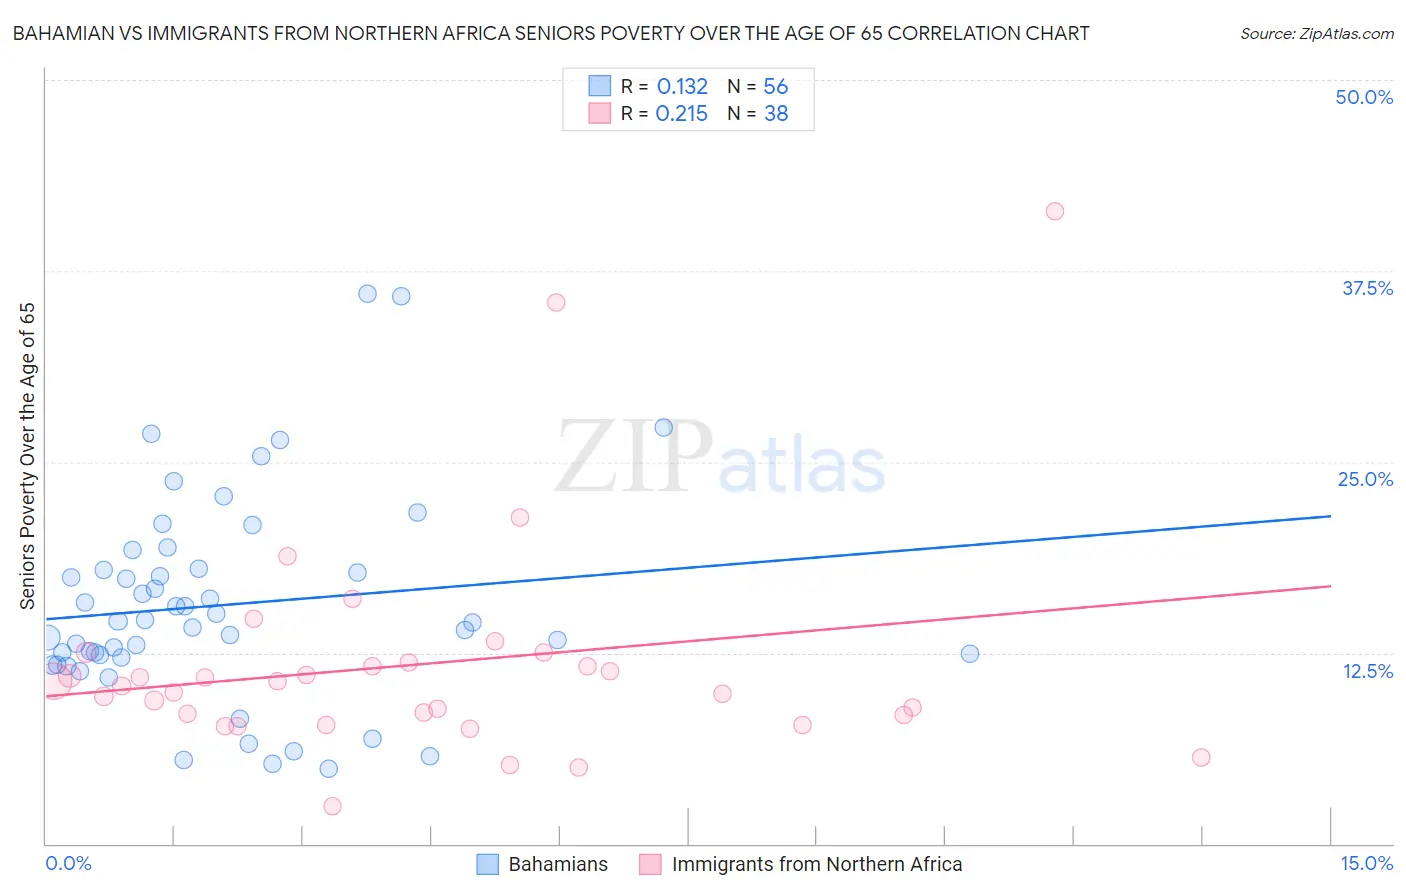
Bahamian vs Immigrants from Northern Africa Seniors Poverty Over the Age of 65 Correlation Chart

The statistical analysis conducted on geographies consisting of 112,479,846 people shows a poor positive correlation between the proportion of Bahamians and poverty level among seniors over the age of 65 in the United States with a correlation coefficient (R) of 0.132 and weighted average of 14.2%. Similarly, the statistical analysis conducted on geographies consisting of 320,561,934 people shows a weak positive correlation between the proportion of Immigrants from Northern Africa and poverty level among seniors over the age of 65 in the United States with a correlation coefficient (R) of 0.215 and weighted average of 11.0%, a difference of 29.6%.
Bahamian vs Immigrants from Northern Africa Seniors Poverty Over the Age of 65

Seniors Poverty Over the Age of 65 Correlation Summary

MeasurementBahamianImmigrants from Northern Africa
Minimum4.9%2.4%
Maximum36.0%41.4%
Range31.1%39.0%
Mean15.6%11.8%
Median14.5%10.5%
Interquartile 25% (IQ1)12.3%8.5%
Interquartile 75% (IQ3)18.0%11.8%
Interquartile Range (IQR)5.7%3.4%
Standard Deviation (Sample)6.7%7.3%
Standard Deviation (Population)6.7%7.2%

Similar Demographics by Seniors Poverty Over the Age of 65

Demographics Similar to Bahamians by Seniors Poverty Over the Age of 65

In terms of seniors poverty over the age of 65, the demographic groups most similar to Bahamians are Native/Alaskan (14.2%, a difference of 0.010%), Honduran (14.2%, a difference of 0.26%), Trinidadian and Tobagonian (14.2%, a difference of 0.36%), Immigrants from West Indies (14.2%, a difference of 0.43%), and Hispanic or Latino (14.3%, a difference of 0.54%).
DemographicsRating | RankSeniors Poverty Over the Age of 65
Immigrants | Bangladesh
0.0
/100
|
#303
Tragic
14.1%
West Indians
0.0
/100
|
#304
Tragic
14.1%
Immigrants | Trinidad and Tobago
0.0
/100
|
#305
Tragic
14.1%
Immigrants | Latin America
0.0
/100
|
#306
Tragic
14.2%
Immigrants | West Indies
0.0
/100
|
#307
Tragic
14.2%
Trinidadians and Tobagonians
0.0
/100
|
#308
Tragic
14.2%
Hondurans
0.0
/100
|
#309
Tragic
14.2%
Bahamians
0.0
/100
|
#310
Tragic
14.2%
Natives/Alaskans
0.0
/100
|
#311
Tragic
14.2%
Hispanics or Latinos
0.0
/100
|
#312
Tragic
14.3%
Barbadians
0.0
/100
|
#313
Tragic
14.4%
Guyanese
0.0
/100
|
#314
Tragic
14.4%
Immigrants | Ecuador
0.0
/100
|
#315
Tragic
14.4%
Immigrants | Guyana
0.0
/100
|
#316
Tragic
14.5%
Haitians
0.0
/100
|
#317
Tragic
14.5%

Demographics Similar to Immigrants from Northern Africa by Seniors Poverty Over the Age of 65

In terms of seniors poverty over the age of 65, the demographic groups most similar to Immigrants from Northern Africa are Immigrants from Thailand (11.0%, a difference of 0.10%), Immigrants from Eastern Africa (11.0%, a difference of 0.10%), German Russian (11.0%, a difference of 0.21%), Immigrants from Fiji (11.0%, a difference of 0.23%), and Cherokee (11.0%, a difference of 0.25%).
DemographicsRating | RankSeniors Poverty Over the Age of 65
Immigrants | Syria
54.7
/100
|
#172
Average
10.9%
Spaniards
50.7
/100
|
#173
Average
10.9%
Immigrants | Sudan
50.0
/100
|
#174
Average
10.9%
Creek
49.6
/100
|
#175
Average
10.9%
Immigrants | Malaysia
47.9
/100
|
#176
Average
11.0%
Cherokee
47.3
/100
|
#177
Average
11.0%
German Russians
46.9
/100
|
#178
Average
11.0%
Immigrants | Northern Africa
44.6
/100
|
#179
Average
11.0%
Immigrants | Thailand
43.5
/100
|
#180
Average
11.0%
Immigrants | Eastern Africa
43.4
/100
|
#181
Average
11.0%
Immigrants | Fiji
42.0
/100
|
#182
Average
11.0%
Immigrants | Kazakhstan
41.0
/100
|
#183
Average
11.0%
Immigrants | France
40.9
/100
|
#184
Average
11.0%
Immigrants | Lebanon
38.2
/100
|
#185
Fair
11.1%
Immigrants | Eastern Asia
37.5
/100
|
#186
Fair
11.1%