Austrian vs Immigrants from Cameroon Family Poverty
COMPARE
Austrian
Immigrants from Cameroon
Family Poverty
Family Poverty Comparison
Austrians
Immigrants from Cameroon
7.8%
FAMILY POVERTY
98.2/ 100
METRIC RATING
73rd/ 347
METRIC RANK
9.0%
FAMILY POVERTY
47.1/ 100
METRIC RATING
178th/ 347
METRIC RANK
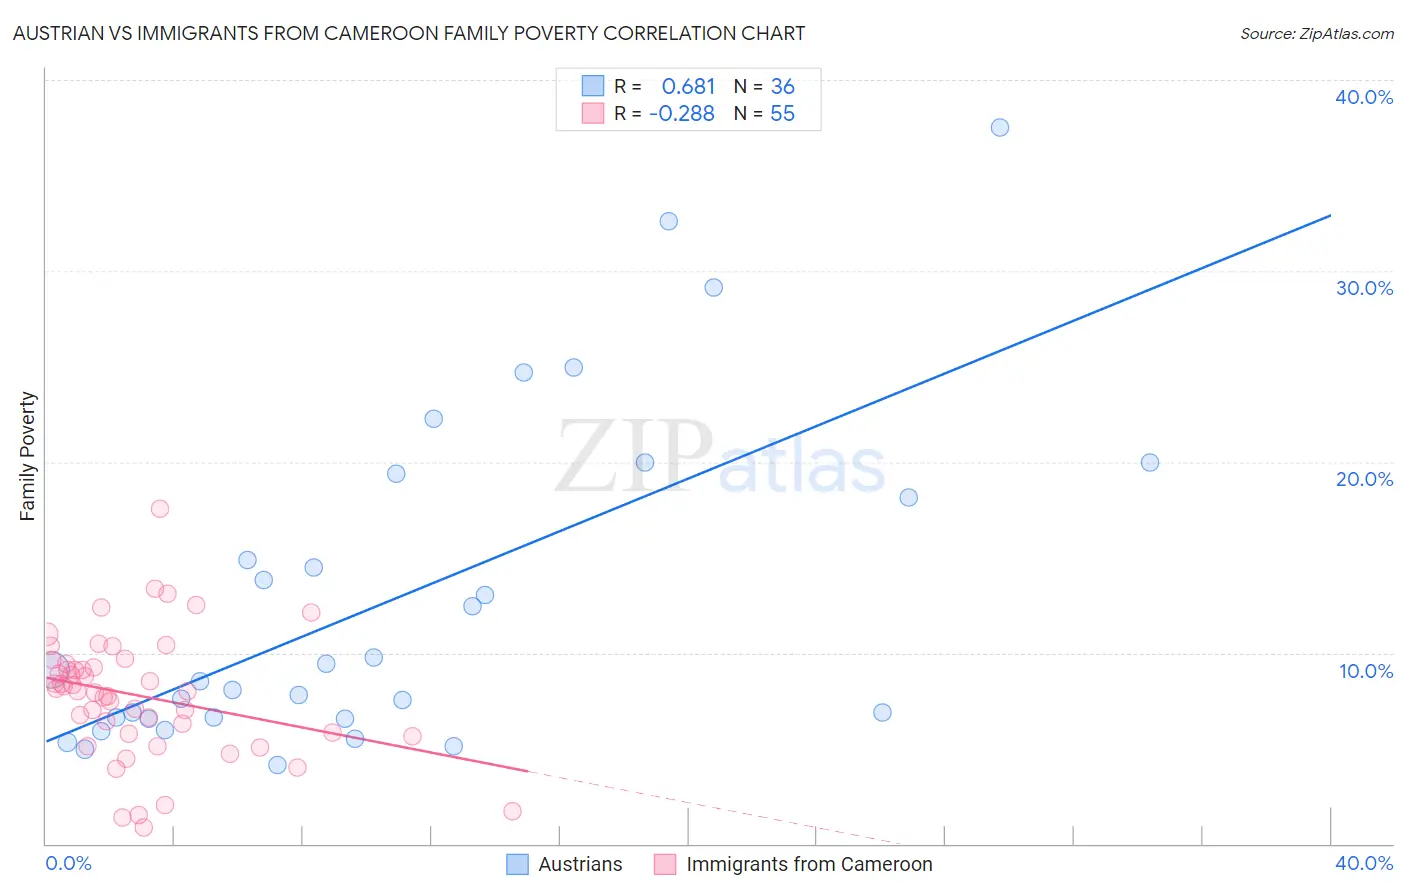
Austrian vs Immigrants from Cameroon Family Poverty Correlation Chart
The statistical analysis conducted on geographies consisting of 450,050,339 people shows a significant positive correlation between the proportion of Austrians and poverty level among families in the United States with a correlation coefficient (R) of 0.681 and weighted average of 7.8%. Similarly, the statistical analysis conducted on geographies consisting of 130,510,031 people shows a weak negative correlation between the proportion of Immigrants from Cameroon and poverty level among families in the United States with a correlation coefficient (R) of -0.288 and weighted average of 9.0%, a difference of 15.4%.
Family Poverty Correlation Summary
| Measurement | Austrian | Immigrants from Cameroon |
| Minimum | 4.1% | 0.83% |
| Maximum | 37.5% | 17.5% |
| Range | 33.4% | 16.7% |
| Mean | 12.8% | 7.8% |
| Median | 8.8% | 8.0% |
| Interquartile 25% (IQ1) | 6.6% | 5.7% |
| Interquartile 75% (IQ3) | 18.8% | 9.5% |
| Interquartile Range (IQR) | 12.2% | 3.7% |
| Standard Deviation (Sample) | 8.6% | 3.2% |
| Standard Deviation (Population) | 8.5% | 3.2% |
Similar Demographics by Family Poverty
Demographics Similar to Austrians by Family Poverty
In terms of family poverty, the demographic groups most similar to Austrians are Immigrants from Romania (7.8%, a difference of 0.0%), Cambodian (7.8%, a difference of 0.060%), Immigrants from China (7.8%, a difference of 0.070%), Immigrants from Canada (7.8%, a difference of 0.080%), and Immigrants from Belgium (7.8%, a difference of 0.13%).
| Demographics | Rating | Rank | Family Poverty |
| Dutch | 98.3 /100 | #66 | Exceptional 7.8% |
| Northern Europeans | 98.3 /100 | #67 | Exceptional 7.8% |
| Australians | 98.2 /100 | #68 | Exceptional 7.8% |
| Immigrants | Belgium | 98.2 /100 | #69 | Exceptional 7.8% |
| Immigrants | Canada | 98.2 /100 | #70 | Exceptional 7.8% |
| Cambodians | 98.2 /100 | #71 | Exceptional 7.8% |
| Immigrants | Romania | 98.2 /100 | #72 | Exceptional 7.8% |
| Austrians | 98.2 /100 | #73 | Exceptional 7.8% |
| Immigrants | China | 98.1 /100 | #74 | Exceptional 7.8% |
| Immigrants | Croatia | 98.1 /100 | #75 | Exceptional 7.8% |
| Immigrants | Latvia | 98.0 /100 | #76 | Exceptional 7.9% |
| Ukrainians | 98.0 /100 | #77 | Exceptional 7.9% |
| Immigrants | North America | 97.9 /100 | #78 | Exceptional 7.9% |
| Immigrants | Europe | 97.8 /100 | #79 | Exceptional 7.9% |
| English | 97.8 /100 | #80 | Exceptional 7.9% |
Demographics Similar to Immigrants from Cameroon by Family Poverty
In terms of family poverty, the demographic groups most similar to Immigrants from Cameroon are Hawaiian (9.0%, a difference of 0.010%), Immigrants from Syria (9.0%, a difference of 0.040%), Costa Rican (9.0%, a difference of 0.28%), Immigrants from Iraq (9.1%, a difference of 0.36%), and Immigrants from Albania (9.0%, a difference of 0.37%).
| Demographics | Rating | Rank | Family Poverty |
| Lebanese | 57.6 /100 | #171 | Average 8.9% |
| Immigrants | Peru | 57.5 /100 | #172 | Average 8.9% |
| Immigrants | Fiji | 56.4 /100 | #173 | Average 8.9% |
| Immigrants | Albania | 50.0 /100 | #174 | Average 9.0% |
| Costa Ricans | 49.3 /100 | #175 | Average 9.0% |
| Immigrants | Syria | 47.5 /100 | #176 | Average 9.0% |
| Hawaiians | 47.2 /100 | #177 | Average 9.0% |
| Immigrants | Cameroon | 47.1 /100 | #178 | Average 9.0% |
| Immigrants | Iraq | 44.4 /100 | #179 | Average 9.1% |
| Immigrants | Uganda | 43.4 /100 | #180 | Average 9.1% |
| Hmong | 40.2 /100 | #181 | Average 9.1% |
| Immigrants | Morocco | 40.2 /100 | #182 | Average 9.1% |
| Uruguayans | 39.2 /100 | #183 | Fair 9.1% |
| South American Indians | 38.7 /100 | #184 | Fair 9.1% |
| Immigrants | Saudi Arabia | 38.6 /100 | #185 | Fair 9.1% |