Australian vs Greek Single Female Poverty

COMPARE

Australian
Race
Ancestry
AfghanAfricanAlaska NativeAlaskan AthabascanAlbanianAleutAlsatianAmericanApacheArabArapahoArgentineanArmenianAssyrian/Chaldean/SyriacAustralianAustrianBahamianBangladeshiBarbadianBasqueBelgianBelizeanBermudanBhutaneseBlackfeetBolivianBrazilianBritishBritish West IndianBulgarianBurmeseCajunCambodianCanadianCape VerdeanCarpatho RusynCelticCentral AmericanCentral American IndianCherokeeCheyenneChickasawChileanChineseChippewaChoctawColombianColvilleComancheCosta RicanCreeCreekCroatianCrowCubanCypriotCzechCzechoslovakianDanishDelawareDominicanDutchDutch West IndianEastern EuropeanEcuadorianEgyptianEnglishEstonianEthiopianEuropeanFijianFilipinoFinnishFrenchFrench American IndianFrench CanadianGermanGerman RussianGhanaianGuamanian/ChamorroGuatemalanGuyaneseHaitianHmongHonduranHopiHoumaHungarianIcelanderIndian (Asian)IndonesianInupiatIranianIraqiIrishIroquoisIsraeliItalianJamaicanJapaneseJordanianKenyanKiowaKoreanLaotianLatvianLebaneseLiberianLithuanianLumbeeLuxembourgerMacedonianMalaysianMalteseMarshalleseMenomineeMexicanMexican American IndianMongolianMoroccanNative HawaiianNavajoNepaleseNew ZealanderNicaraguanNigerianNorthern EuropeanNorwegianOkinawanOsageOttawaPaiutePakistaniPalestinianPanamanianParaguayanPennsylvania GermanPeruvianPimaPolishPortuguesePotawatomiPuebloPuerto RicanPuget Sound SalishRomanianRussianSalvadoranSamoanScandinavianScotch-IrishScottishSeminoleSenegaleseSerbianShoshoneSierra LeoneanSiouxSlavicSlovakSloveneSomaliSouth AfricanSouth AmericanSouth American IndianSoviet UnionSpaniardSpanishSpanish AmericanSpanish American IndianSri LankanSubsaharan AfricanSudaneseSwedishSwissSyrianTaiwaneseThaiTlingit-HaidaTohono O'OdhamTonganTrinidadian and TobagonianTsimshianTurkishU.S. Virgin IslanderUgandanUkrainianUruguayanUteVenezuelanVietnameseWelshWest IndianYakamaYaquiYugoslavianYumanYup'ikZimbabwean
Immigration
NonimmigrantsImmigrantsAfghanistanAfricaAlbaniaArgentinaArmeniaAsiaAustraliaAustriaBahamasBangladeshBarbadosBelarusBelgiumBelizeBoliviaBosnia and HerzegovinaBrazilBulgariaBurma/MyanmarCabo VerdeCambodiaCameroonCanadaCaribbeanCentral AmericaChileChinaColombiaCongoCosta RicaCroatiaCubaCzechoslovakiaDenmarkDominicaDominican RepublicEastern AfricaEastern AsiaEastern EuropeEcuadorEgyptEl SalvadorEnglandEritreaEthiopiaEuropeFijiFranceGermanyGhanaGreeceGrenadaGuatemalaGuyanaHaitiHondurasHong KongHungaryIndiaIndonesiaIranIraqIrelandIsraelItalyJamaicaJapanJordanKazakhstanKenyaKoreaKuwaitLaosLatin AmericaLatviaLebanonLiberiaLithuaniaMalaysiaMexicoMicronesiaMiddle AfricaMoldovaMoroccoNepalNetherlandsNicaraguaNigeriaNorth AmericaNorth MacedoniaNorthern AfricaNorthern EuropeNorwayOceaniaPakistanPanamaPeruPhilippinesPolandPortugalRomaniaRussiaSaudi ArabiaScotlandSenegalSerbiaSierra LeoneSingaporeSomaliaSouth AfricaSouth AmericaSouth Central AsiaSouth Eastern AsiaSouthern EuropeSpainSri LankaSt. Vincent and the GrenadinesSudanSwedenSwitzerlandSyriaTaiwanThailandTrinidad and TobagoTurkeyUgandaUkraineUruguayUzbekistanVenezuelaVietnamWest IndiesWestern AfricaWestern AsiaWestern EuropeYemenZaireZimbabweAzores
Greek
Race
Ancestry
AfghanAfricanAlaska NativeAlaskan AthabascanAlbanianAleutAlsatianAmericanApacheArabArapahoArgentineanArmenianAssyrian/Chaldean/SyriacAustrianBahamianBangladeshiBarbadianBasqueBelgianBelizeanBermudanBhutaneseBlackfeetBolivianBrazilianBritishBritish West IndianBulgarianBurmeseCajunCambodianCanadianCape VerdeanCarpatho RusynCelticCentral AmericanCentral American IndianCherokeeCheyenneChickasawChileanChineseChippewaChoctawColombianColvilleComancheCosta RicanCreeCreekCroatianCrowCubanCypriotCzechCzechoslovakianDanishDelawareDominicanDutchDutch West IndianEastern EuropeanEcuadorianEgyptianEnglishEstonianEthiopianEuropeanFijianFilipinoFinnishFrenchFrench American IndianFrench CanadianGermanGerman RussianGhanaianGreekGuamanian/ChamorroGuatemalanGuyaneseHaitianHmongHonduranHopiHoumaHungarianIcelanderIndian (Asian)IndonesianInupiatIranianIraqiIrishIroquoisIsraeliItalianJamaicanJapaneseJordanianKenyanKiowaKoreanLaotianLatvianLebaneseLiberianLithuanianLumbeeLuxembourgerMacedonianMalaysianMalteseMarshalleseMenomineeMexicanMexican American IndianMongolianMoroccanNative HawaiianNavajoNepaleseNew ZealanderNicaraguanNigerianNorthern EuropeanNorwegianOkinawanOsageOttawaPaiutePakistaniPalestinianPanamanianParaguayanPennsylvania GermanPeruvianPimaPolishPortuguesePotawatomiPuebloPuerto RicanPuget Sound SalishRomanianRussianSalvadoranSamoanScandinavianScotch-IrishScottishSeminoleSenegaleseSerbianShoshoneSierra LeoneanSiouxSlavicSlovakSloveneSomaliSouth AfricanSouth AmericanSouth American IndianSoviet UnionSpaniardSpanishSpanish AmericanSpanish American IndianSri LankanSubsaharan AfricanSudaneseSwedishSwissSyrianTaiwaneseThaiTlingit-HaidaTohono O'OdhamTonganTrinidadian and TobagonianTsimshianTurkishU.S. Virgin IslanderUgandanUkrainianUruguayanUteVenezuelanVietnameseWelshWest IndianYakamaYaquiYugoslavianYumanYup'ikZimbabwean
Immigration
NonimmigrantsImmigrantsAfghanistanAfricaAlbaniaArgentinaArmeniaAsiaAustraliaAustriaBahamasBangladeshBarbadosBelarusBelgiumBelizeBoliviaBosnia and HerzegovinaBrazilBulgariaBurma/MyanmarCabo VerdeCambodiaCameroonCanadaCaribbeanCentral AmericaChileChinaColombiaCongoCosta RicaCroatiaCubaCzechoslovakiaDenmarkDominicaDominican RepublicEastern AfricaEastern AsiaEastern EuropeEcuadorEgyptEl SalvadorEnglandEritreaEthiopiaEuropeFijiFranceGermanyGhanaGreeceGrenadaGuatemalaGuyanaHaitiHondurasHong KongHungaryIndiaIndonesiaIranIraqIrelandIsraelItalyJamaicaJapanJordanKazakhstanKenyaKoreaKuwaitLaosLatin AmericaLatviaLebanonLiberiaLithuaniaMalaysiaMexicoMicronesiaMiddle AfricaMoldovaMoroccoNepalNetherlandsNicaraguaNigeriaNorth AmericaNorth MacedoniaNorthern AfricaNorthern EuropeNorwayOceaniaPakistanPanamaPeruPhilippinesPolandPortugalRomaniaRussiaSaudi ArabiaScotlandSenegalSerbiaSierra LeoneSingaporeSomaliaSouth AfricaSouth AmericaSouth Central AsiaSouth Eastern AsiaSouthern EuropeSpainSri LankaSt. Vincent and the GrenadinesSudanSwedenSwitzerlandSyriaTaiwanThailandTrinidad and TobagoTurkeyUgandaUkraineUruguayUzbekistanVenezuelaVietnamWest IndiesWestern AfricaWestern AsiaWestern EuropeYemenZaireZimbabweAzores
Single Female Poverty
Income
Poverty
Unemployment
Labor Participation
Family Structure
Vehicle Availability
Education Level
Disability

Single Female Poverty Comparison

Australians

Greeks

Excellent
Exceptional
20.3%
SINGLE FEMALE POVERTY
88.4/ 100
METRIC RATING
143rd/ 347
METRIC RANK
19.4%
SINGLE FEMALE POVERTY
99.2/ 100
METRIC RATING
86th/ 347
METRIC RANK

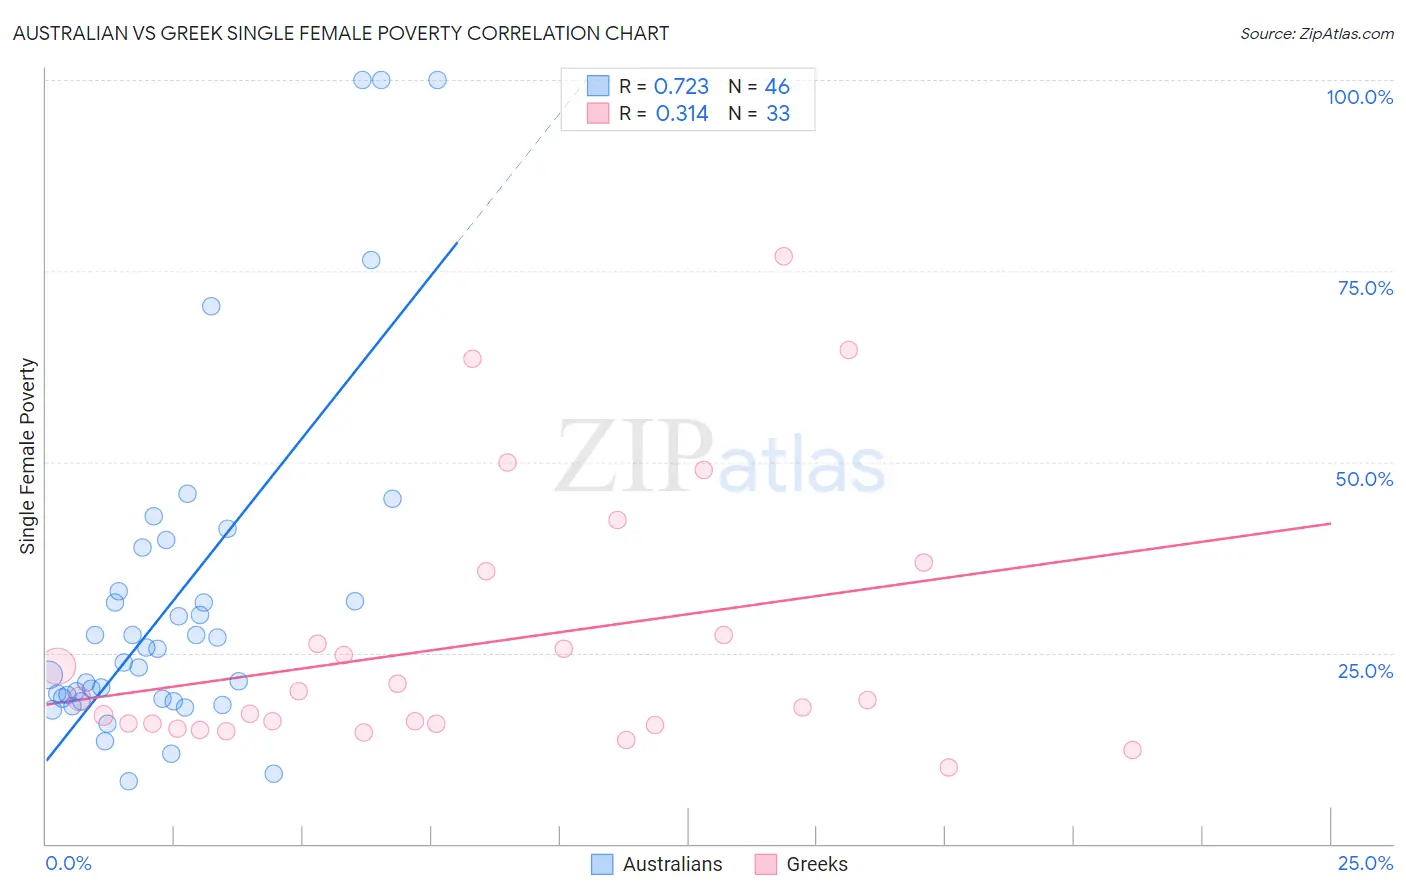
Australian vs Greek Single Female Poverty Correlation Chart

The statistical analysis conducted on geographies consisting of 221,875,753 people shows a strong positive correlation between the proportion of Australians and poverty level among single females in the United States with a correlation coefficient (R) of 0.723 and weighted average of 20.3%. Similarly, the statistical analysis conducted on geographies consisting of 470,908,481 people shows a mild positive correlation between the proportion of Greeks and poverty level among single females in the United States with a correlation coefficient (R) of 0.314 and weighted average of 19.4%, a difference of 4.6%.
Australian vs Greek Single Female Poverty

Single Female Poverty Correlation Summary

MeasurementAustralianGreek
Minimum8.1%10.0%
Maximum100.0%76.9%
Range91.9%66.9%
Mean31.8%26.2%
Median24.7%18.9%
Interquartile 25% (IQ1)19.0%15.7%
Interquartile 75% (IQ3)33.1%31.5%
Interquartile Range (IQR)14.1%15.8%
Standard Deviation (Sample)22.6%17.0%
Standard Deviation (Population)22.4%16.7%

Similar Demographics by Single Female Poverty

Demographics Similar to Australians by Single Female Poverty

In terms of single female poverty, the demographic groups most similar to Australians are Immigrants from Uzbekistan (20.3%, a difference of 0.010%), Immigrants from Uganda (20.3%, a difference of 0.12%), Immigrants from North America (20.3%, a difference of 0.19%), Syrian (20.3%, a difference of 0.34%), and Immigrants from Kuwait (20.3%, a difference of 0.35%).
DemographicsRating | RankSingle Female Poverty
Immigrants | Canada
91.2
/100
|
#136
Exceptional
20.2%
Immigrants | Nepal
90.6
/100
|
#137
Exceptional
20.3%
Slovenes
90.5
/100
|
#138
Exceptional
20.3%
Immigrants | Kuwait
90.4
/100
|
#139
Exceptional
20.3%
Syrians
90.4
/100
|
#140
Exceptional
20.3%
Immigrants | North America
89.5
/100
|
#141
Excellent
20.3%
Immigrants | Uganda
89.1
/100
|
#142
Excellent
20.3%
Australians
88.4
/100
|
#143
Excellent
20.3%
Immigrants | Uzbekistan
88.3
/100
|
#144
Excellent
20.3%
Austrians
85.8
/100
|
#145
Excellent
20.4%
Venezuelans
85.5
/100
|
#146
Excellent
20.4%
South Africans
85.3
/100
|
#147
Excellent
20.4%
Luxembourgers
84.9
/100
|
#148
Excellent
20.4%
Portuguese
81.5
/100
|
#149
Excellent
20.5%
Immigrants | Denmark
80.5
/100
|
#150
Excellent
20.5%

Demographics Similar to Greeks by Single Female Poverty

In terms of single female poverty, the demographic groups most similar to Greeks are Immigrants from Albania (19.4%, a difference of 0.0%), Immigrants from Sweden (19.4%, a difference of 0.040%), Taiwanese (19.4%, a difference of 0.12%), Immigrants from Scotland (19.4%, a difference of 0.14%), and Immigrants from Malaysia (19.4%, a difference of 0.14%).
DemographicsRating | RankSingle Female Poverty
Immigrants | Sierra Leone
99.3
/100
|
#79
Exceptional
19.4%
Immigrants | Australia
99.3
/100
|
#80
Exceptional
19.4%
Immigrants | Scotland
99.2
/100
|
#81
Exceptional
19.4%
Immigrants | Malaysia
99.2
/100
|
#82
Exceptional
19.4%
Taiwanese
99.2
/100
|
#83
Exceptional
19.4%
Immigrants | Sweden
99.2
/100
|
#84
Exceptional
19.4%
Immigrants | Albania
99.2
/100
|
#85
Exceptional
19.4%
Greeks
99.2
/100
|
#86
Exceptional
19.4%
Zimbabweans
99.0
/100
|
#87
Exceptional
19.5%
Afghans
99.0
/100
|
#88
Exceptional
19.5%
Immigrants | Ukraine
99.0
/100
|
#89
Exceptional
19.5%
Immigrants | Lebanon
98.8
/100
|
#90
Exceptional
19.6%
Soviet Union
98.8
/100
|
#91
Exceptional
19.6%
Italians
98.8
/100
|
#92
Exceptional
19.6%
Immigrants | Austria
98.8
/100
|
#93
Exceptional
19.6%