Assyrian/Chaldean/Syriac vs Seminole Child Poverty Under the Age of 16

COMPARE

Assyrian/Chaldean/Syriac
Race
Ancestry
AfghanAfricanAlaska NativeAlaskan AthabascanAlbanianAleutAlsatianAmericanApacheArabArapahoArgentineanArmenianAssyrian/Chaldean/SyriacAustralianAustrianBahamianBangladeshiBarbadianBasqueBelgianBelizeanBermudanBhutaneseBlackfeetBolivianBrazilianBritishBritish West IndianBulgarianBurmeseCajunCambodianCanadianCape VerdeanCarpatho RusynCelticCentral AmericanCentral American IndianCherokeeCheyenneChickasawChileanChineseChippewaChoctawColombianColvilleComancheCosta RicanCreeCreekCroatianCrowCubanCypriotCzechCzechoslovakianDanishDelawareDominicanDutchDutch West IndianEastern EuropeanEcuadorianEgyptianEnglishEstonianEthiopianEuropeanFijianFilipinoFinnishFrenchFrench American IndianFrench CanadianGermanGerman RussianGhanaianGreekGuamanian/ChamorroGuatemalanGuyaneseHaitianHmongHonduranHopiHoumaHungarianIcelanderIndian (Asian)IndonesianInupiatIranianIraqiIrishIroquoisIsraeliItalianJamaicanJapaneseJordanianKenyanKiowaKoreanLaotianLatvianLebaneseLiberianLithuanianLumbeeLuxembourgerMacedonianMalaysianMalteseMarshalleseMenomineeMexicanMexican American IndianMongolianMoroccanNative HawaiianNavajoNepaleseNew ZealanderNicaraguanNigerianNorthern EuropeanNorwegianOkinawanOsageOttawaPaiutePakistaniPalestinianPanamanianParaguayanPennsylvania GermanPeruvianPimaPolishPortuguesePotawatomiPuebloPuerto RicanPuget Sound SalishRomanianRussianSalvadoranSamoanScandinavianScotch-IrishScottishSenegaleseSerbianShoshoneSierra LeoneanSiouxSlavicSlovakSloveneSomaliSouth AfricanSouth AmericanSouth American IndianSoviet UnionSpaniardSpanishSpanish AmericanSpanish American IndianSri LankanSubsaharan AfricanSudaneseSwedishSwissSyrianTaiwaneseThaiTlingit-HaidaTohono O'OdhamTonganTrinidadian and TobagonianTsimshianTurkishU.S. Virgin IslanderUgandanUkrainianUruguayanUteVenezuelanVietnameseWelshWest IndianYakamaYaquiYugoslavianYumanYup'ikZimbabwean
Immigration
NonimmigrantsImmigrantsAfghanistanAfricaAlbaniaArgentinaArmeniaAsiaAustraliaAustriaBahamasBangladeshBarbadosBelarusBelgiumBelizeBoliviaBosnia and HerzegovinaBrazilBulgariaBurma/MyanmarCabo VerdeCambodiaCameroonCanadaCaribbeanCentral AmericaChileChinaColombiaCongoCosta RicaCroatiaCubaCzechoslovakiaDenmarkDominicaDominican RepublicEastern AfricaEastern AsiaEastern EuropeEcuadorEgyptEl SalvadorEnglandEritreaEthiopiaEuropeFijiFranceGermanyGhanaGreeceGrenadaGuatemalaGuyanaHaitiHondurasHong KongHungaryIndiaIndonesiaIranIraqIrelandIsraelItalyJamaicaJapanJordanKazakhstanKenyaKoreaKuwaitLaosLatin AmericaLatviaLebanonLiberiaLithuaniaMalaysiaMexicoMicronesiaMiddle AfricaMoldovaMoroccoNepalNetherlandsNicaraguaNigeriaNorth AmericaNorth MacedoniaNorthern AfricaNorthern EuropeNorwayOceaniaPakistanPanamaPeruPhilippinesPolandPortugalRomaniaRussiaSaudi ArabiaScotlandSenegalSerbiaSierra LeoneSingaporeSomaliaSouth AfricaSouth AmericaSouth Central AsiaSouth Eastern AsiaSouthern EuropeSpainSri LankaSt. Vincent and the GrenadinesSudanSwedenSwitzerlandSyriaTaiwanThailandTrinidad and TobagoTurkeyUgandaUkraineUruguayUzbekistanVenezuelaVietnamWest IndiesWestern AfricaWestern AsiaWestern EuropeYemenZaireZimbabweAzores
Seminole
Race
Ancestry
AfghanAfricanAlaska NativeAlaskan AthabascanAlbanianAleutAlsatianAmericanApacheArabArapahoArgentineanArmenianAustralianAustrianBahamianBangladeshiBarbadianBasqueBelgianBelizeanBermudanBhutaneseBlackfeetBolivianBrazilianBritishBritish West IndianBulgarianBurmeseCajunCambodianCanadianCape VerdeanCarpatho RusynCelticCentral AmericanCentral American IndianCherokeeCheyenneChickasawChileanChineseChippewaChoctawColombianColvilleComancheCosta RicanCreeCreekCroatianCrowCubanCypriotCzechCzechoslovakianDanishDelawareDominicanDutchDutch West IndianEastern EuropeanEcuadorianEgyptianEnglishEstonianEthiopianEuropeanFijianFilipinoFinnishFrenchFrench American IndianFrench CanadianGermanGerman RussianGhanaianGreekGuamanian/ChamorroGuatemalanGuyaneseHaitianHmongHonduranHopiHoumaHungarianIcelanderIndian (Asian)IndonesianInupiatIranianIraqiIrishIroquoisIsraeliItalianJamaicanJapaneseJordanianKenyanKiowaKoreanLaotianLatvianLebaneseLiberianLithuanianLumbeeLuxembourgerMacedonianMalaysianMalteseMarshalleseMenomineeMexicanMexican American IndianMongolianMoroccanNative HawaiianNavajoNepaleseNew ZealanderNicaraguanNigerianNorthern EuropeanNorwegianOkinawanOsageOttawaPaiutePakistaniPalestinianPanamanianParaguayanPennsylvania GermanPeruvianPimaPolishPortuguesePotawatomiPuebloPuerto RicanPuget Sound SalishRomanianRussianSalvadoranSamoanScandinavianScotch-IrishScottishSeminoleSenegaleseSerbianShoshoneSierra LeoneanSiouxSlavicSlovakSloveneSomaliSouth AfricanSouth AmericanSouth American IndianSoviet UnionSpaniardSpanishSpanish AmericanSpanish American IndianSri LankanSubsaharan AfricanSudaneseSwedishSwissSyrianTaiwaneseThaiTlingit-HaidaTohono O'OdhamTonganTrinidadian and TobagonianTsimshianTurkishU.S. Virgin IslanderUgandanUkrainianUruguayanUteVenezuelanVietnameseWelshWest IndianYakamaYaquiYugoslavianYumanYup'ikZimbabwean
Immigration
NonimmigrantsImmigrantsAfghanistanAfricaAlbaniaArgentinaArmeniaAsiaAustraliaAustriaBahamasBangladeshBarbadosBelarusBelgiumBelizeBoliviaBosnia and HerzegovinaBrazilBulgariaBurma/MyanmarCabo VerdeCambodiaCameroonCanadaCaribbeanCentral AmericaChileChinaColombiaCongoCosta RicaCroatiaCubaCzechoslovakiaDenmarkDominicaDominican RepublicEastern AfricaEastern AsiaEastern EuropeEcuadorEgyptEl SalvadorEnglandEritreaEthiopiaEuropeFijiFranceGermanyGhanaGreeceGrenadaGuatemalaGuyanaHaitiHondurasHong KongHungaryIndiaIndonesiaIranIraqIrelandIsraelItalyJamaicaJapanJordanKazakhstanKenyaKoreaKuwaitLaosLatin AmericaLatviaLebanonLiberiaLithuaniaMalaysiaMexicoMicronesiaMiddle AfricaMoldovaMoroccoNepalNetherlandsNicaraguaNigeriaNorth AmericaNorth MacedoniaNorthern AfricaNorthern EuropeNorwayOceaniaPakistanPanamaPeruPhilippinesPolandPortugalRomaniaRussiaSaudi ArabiaScotlandSenegalSerbiaSierra LeoneSingaporeSomaliaSouth AfricaSouth AmericaSouth Central AsiaSouth Eastern AsiaSouthern EuropeSpainSri LankaSt. Vincent and the GrenadinesSudanSwedenSwitzerlandSyriaTaiwanThailandTrinidad and TobagoTurkeyUgandaUkraineUruguayUzbekistanVenezuelaVietnamWest IndiesWestern AfricaWestern AsiaWestern EuropeYemenZaireZimbabweAzores
Child Poverty Under the Age of 16
Income
Poverty
Unemployment
Labor Participation
Family Structure
Vehicle Availability
Education Level
Disability

Child Poverty Under the Age of 16 Comparison

Assyrians/Chaldeans/Syriacs

Seminole

Exceptional
Tragic
13.3%
CHILD POVERTY UNDER THE AGE OF 16
99.7/ 100
METRIC RATING
28th/ 347
METRIC RANK
21.1%
CHILD POVERTY UNDER THE AGE OF 16
0.0/ 100
METRIC RATING
305th/ 347
METRIC RANK

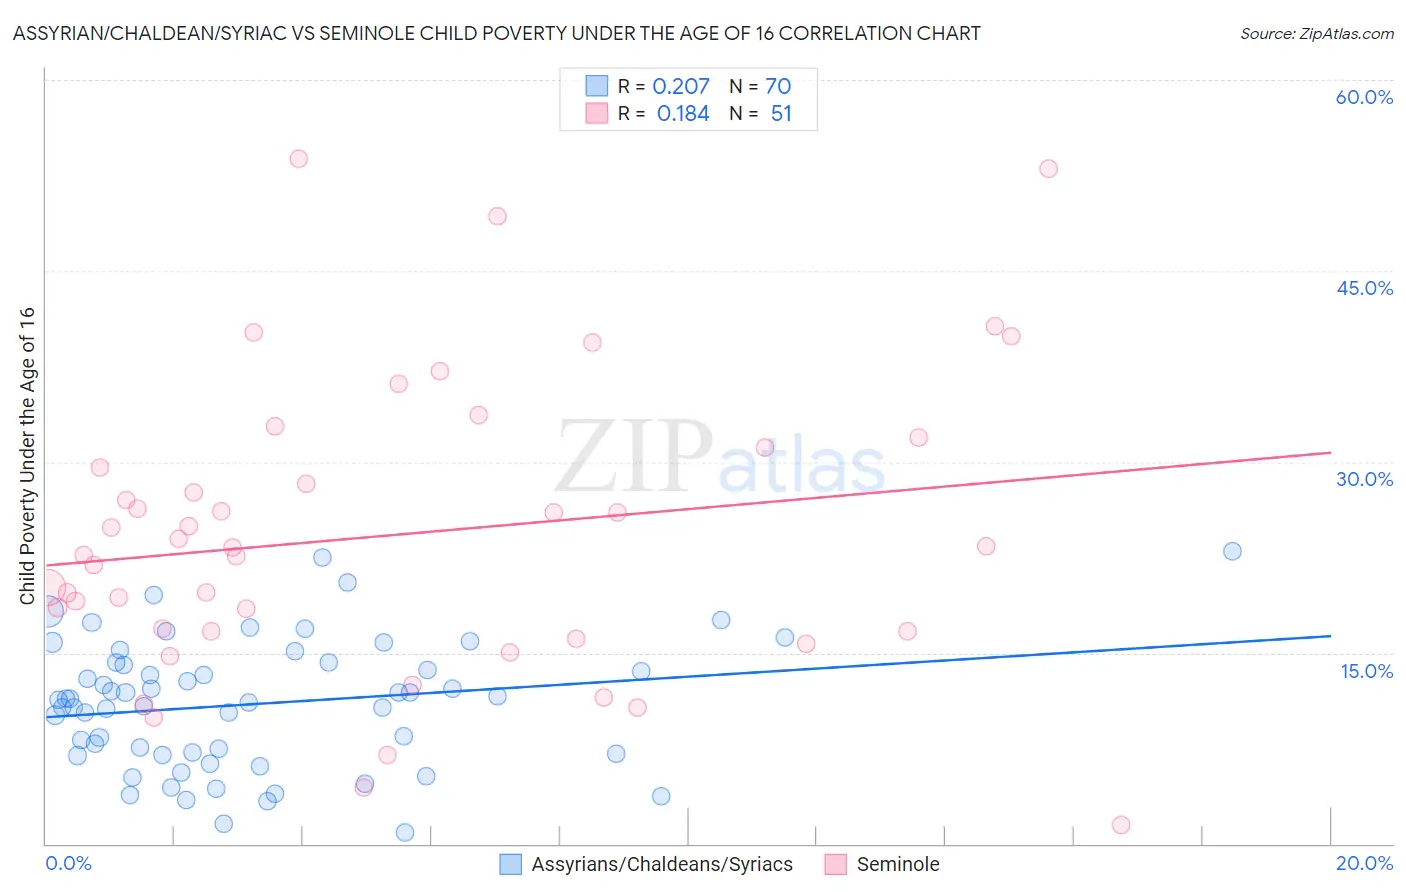
Assyrian/Chaldean/Syriac vs Seminole Child Poverty Under the Age of 16 Correlation Chart

The statistical analysis conducted on geographies consisting of 109,836,821 people shows a weak positive correlation between the proportion of Assyrians/Chaldeans/Syriacs and poverty level among children under the age of 16 in the United States with a correlation coefficient (R) of 0.207 and weighted average of 13.3%. Similarly, the statistical analysis conducted on geographies consisting of 118,162,960 people shows a poor positive correlation between the proportion of Seminole and poverty level among children under the age of 16 in the United States with a correlation coefficient (R) of 0.184 and weighted average of 21.1%, a difference of 58.8%.
Assyrian/Chaldean/Syriac vs Seminole Child Poverty Under the Age of 16

Child Poverty Under the Age of 16 Correlation Summary

MeasurementAssyrian/Chaldean/SyriacSeminole
Minimum0.91%1.5%
Maximum23.0%53.8%
Range22.1%52.4%
Mean11.0%24.3%
Median11.3%23.3%
Interquartile 25% (IQ1)7.0%16.7%
Interquartile 75% (IQ3)14.2%31.1%
Interquartile Range (IQR)7.2%14.5%
Standard Deviation (Sample)5.0%11.6%
Standard Deviation (Population)5.0%11.5%

Similar Demographics by Child Poverty Under the Age of 16

Demographics Similar to Assyrians/Chaldeans/Syriacs by Child Poverty Under the Age of 16

In terms of child poverty under the age of 16, the demographic groups most similar to Assyrians/Chaldeans/Syriacs are Swedish (13.3%, a difference of 0.18%), Immigrants from China (13.3%, a difference of 0.24%), Turkish (13.4%, a difference of 0.48%), Bolivian (13.2%, a difference of 0.53%), and Danish (13.4%, a difference of 0.68%).
DemographicsRating | RankChild Poverty Under the Age of 16
Immigrants | Eastern Asia
99.8
/100
|
#21
Exceptional
13.1%
Maltese
99.8
/100
|
#22
Exceptional
13.1%
Indians (Asian)
99.8
/100
|
#23
Exceptional
13.1%
Latvians
99.8
/100
|
#24
Exceptional
13.2%
Eastern Europeans
99.8
/100
|
#25
Exceptional
13.2%
Bolivians
99.8
/100
|
#26
Exceptional
13.2%
Immigrants | China
99.8
/100
|
#27
Exceptional
13.3%
Assyrians/Chaldeans/Syriacs
99.7
/100
|
#28
Exceptional
13.3%
Swedes
99.7
/100
|
#29
Exceptional
13.3%
Turks
99.7
/100
|
#30
Exceptional
13.4%
Danes
99.7
/100
|
#31
Exceptional
13.4%
Tongans
99.7
/100
|
#32
Exceptional
13.4%
Asians
99.6
/100
|
#33
Exceptional
13.5%
Russians
99.6
/100
|
#34
Exceptional
13.5%
Lithuanians
99.6
/100
|
#35
Exceptional
13.5%

Demographics Similar to Seminole by Child Poverty Under the Age of 16

In terms of child poverty under the age of 16, the demographic groups most similar to Seminole are Guatemalan (21.2%, a difference of 0.16%), Somali (21.0%, a difference of 0.47%), Choctaw (21.0%, a difference of 0.52%), Immigrants from Bahamas (21.0%, a difference of 0.56%), and Immigrants from Central America (21.3%, a difference of 0.57%).
DemographicsRating | RankChild Poverty Under the Age of 16
Arapaho
0.0
/100
|
#298
Tragic
20.8%
Immigrants | Haiti
0.0
/100
|
#299
Tragic
20.9%
Indonesians
0.0
/100
|
#300
Tragic
21.0%
Immigrants | Grenada
0.0
/100
|
#301
Tragic
21.0%
Immigrants | Bahamas
0.0
/100
|
#302
Tragic
21.0%
Choctaw
0.0
/100
|
#303
Tragic
21.0%
Somalis
0.0
/100
|
#304
Tragic
21.0%
Seminole
0.0
/100
|
#305
Tragic
21.1%
Guatemalans
0.0
/100
|
#306
Tragic
21.2%
Immigrants | Central America
0.0
/100
|
#307
Tragic
21.3%
British West Indians
0.0
/100
|
#308
Tragic
21.3%
Immigrants | Mexico
0.0
/100
|
#309
Tragic
21.5%
Bahamians
0.0
/100
|
#310
Tragic
21.5%
Dutch West Indians
0.0
/100
|
#311
Tragic
21.5%
Ute
0.0
/100
|
#312
Tragic
21.5%