Asian vs Immigrants from Barbados Single Mother Poverty
COMPARE
Asian
Immigrants from Barbados
Single Mother Poverty
Single Mother Poverty Comparison
Asians
Immigrants from Barbados
26.0%
SINGLE MOTHER POVERTY
100.0/ 100
METRIC RATING
17th/ 347
METRIC RANK
30.2%
SINGLE MOTHER POVERTY
5.0/ 100
METRIC RATING
229th/ 347
METRIC RANK
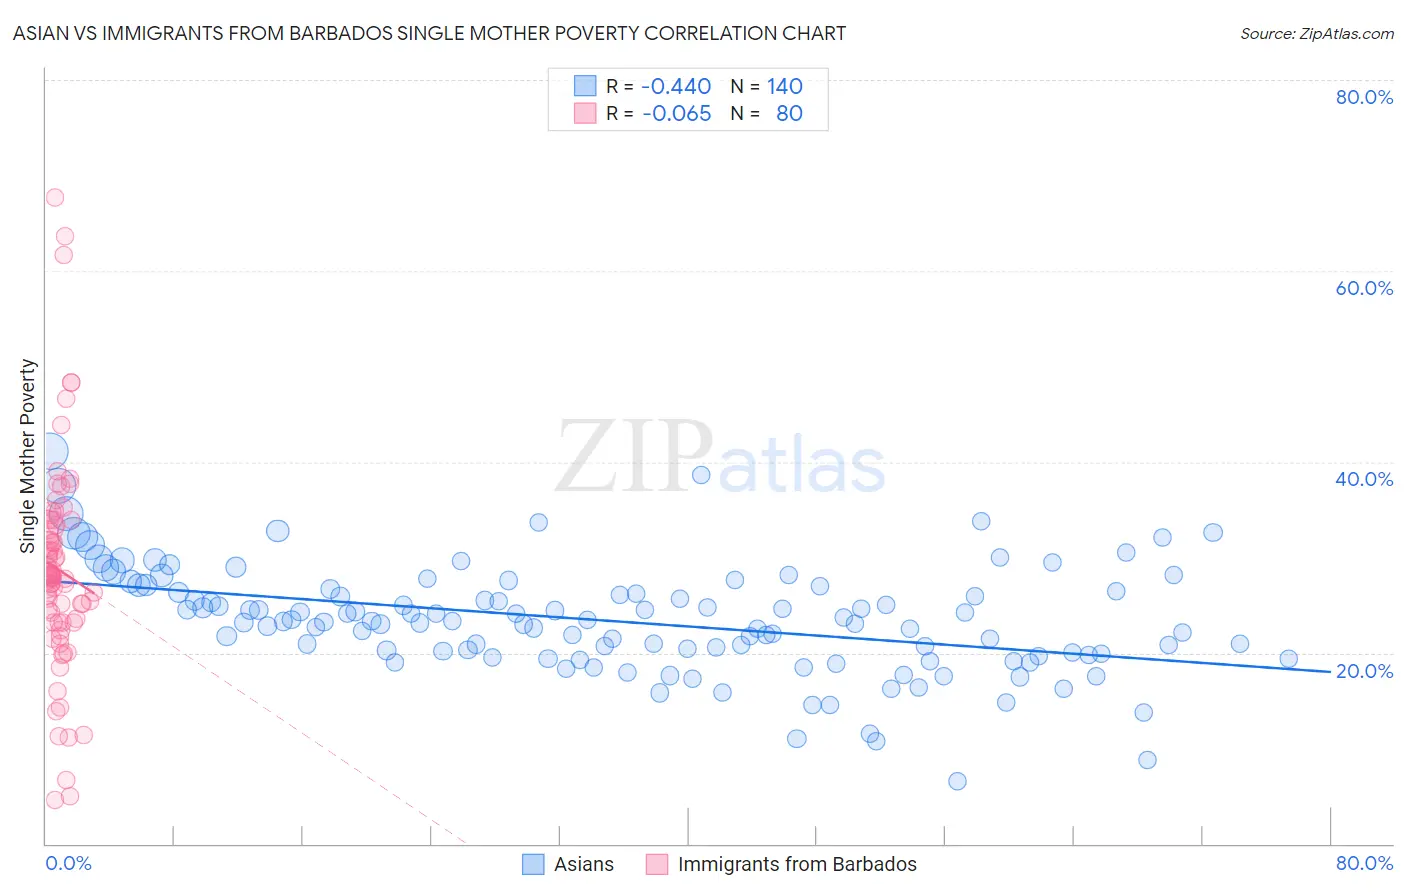
Asian vs Immigrants from Barbados Single Mother Poverty Correlation Chart
The statistical analysis conducted on geographies consisting of 527,260,509 people shows a moderate negative correlation between the proportion of Asians and poverty level among single mothers in the United States with a correlation coefficient (R) of -0.440 and weighted average of 26.0%. Similarly, the statistical analysis conducted on geographies consisting of 111,955,379 people shows a slight negative correlation between the proportion of Immigrants from Barbados and poverty level among single mothers in the United States with a correlation coefficient (R) of -0.065 and weighted average of 30.2%, a difference of 16.3%.
Single Mother Poverty Correlation Summary
| Measurement | Asian | Immigrants from Barbados |
| Minimum | 6.6% | 4.6% |
| Maximum | 41.1% | 67.7% |
| Range | 34.6% | 63.0% |
| Mean | 23.3% | 28.7% |
| Median | 23.3% | 27.9% |
| Interquartile 25% (IQ1) | 19.9% | 23.2% |
| Interquartile 75% (IQ3) | 26.4% | 33.2% |
| Interquartile Range (IQR) | 6.5% | 10.0% |
| Standard Deviation (Sample) | 5.6% | 11.2% |
| Standard Deviation (Population) | 5.6% | 11.1% |
Similar Demographics by Single Mother Poverty
Demographics Similar to Asians by Single Mother Poverty
In terms of single mother poverty, the demographic groups most similar to Asians are Bolivian (25.9%, a difference of 0.18%), Immigrants from Pakistan (26.0%, a difference of 0.28%), Immigrants from Eastern Asia (26.1%, a difference of 0.43%), Immigrants from Ireland (25.8%, a difference of 0.47%), and Immigrants from China (26.1%, a difference of 0.55%).
| Demographics | Rating | Rank | Single Mother Poverty |
| Immigrants | South Central Asia | 100.0 /100 | #10 | Exceptional 25.3% |
| Iranians | 100.0 /100 | #11 | Exceptional 25.5% |
| Bhutanese | 100.0 /100 | #12 | Exceptional 25.6% |
| Indians (Asian) | 100.0 /100 | #13 | Exceptional 25.8% |
| Immigrants | Singapore | 100.0 /100 | #14 | Exceptional 25.8% |
| Immigrants | Ireland | 100.0 /100 | #15 | Exceptional 25.8% |
| Bolivians | 100.0 /100 | #16 | Exceptional 25.9% |
| Asians | 100.0 /100 | #17 | Exceptional 26.0% |
| Immigrants | Pakistan | 100.0 /100 | #18 | Exceptional 26.0% |
| Immigrants | Eastern Asia | 100.0 /100 | #19 | Exceptional 26.1% |
| Immigrants | China | 100.0 /100 | #20 | Exceptional 26.1% |
| Immigrants | Bolivia | 100.0 /100 | #21 | Exceptional 26.2% |
| Immigrants | Korea | 100.0 /100 | #22 | Exceptional 26.2% |
| Burmese | 100.0 /100 | #23 | Exceptional 26.2% |
| Immigrants | Moldova | 100.0 /100 | #24 | Exceptional 26.2% |
Demographics Similar to Immigrants from Barbados by Single Mother Poverty
In terms of single mother poverty, the demographic groups most similar to Immigrants from Barbados are English (30.2%, a difference of 0.040%), Spaniard (30.2%, a difference of 0.090%), Dutch (30.2%, a difference of 0.19%), Immigrants from Liberia (30.1%, a difference of 0.20%), and Scottish (30.1%, a difference of 0.23%).
| Demographics | Rating | Rank | Single Mother Poverty |
| Sudanese | 7.6 /100 | #222 | Tragic 30.0% |
| Immigrants | Cuba | 6.9 /100 | #223 | Tragic 30.1% |
| Immigrants | Sudan | 6.5 /100 | #224 | Tragic 30.1% |
| Spanish | 6.3 /100 | #225 | Tragic 30.1% |
| Scottish | 6.0 /100 | #226 | Tragic 30.1% |
| Immigrants | Liberia | 5.9 /100 | #227 | Tragic 30.1% |
| Spaniards | 5.4 /100 | #228 | Tragic 30.2% |
| Immigrants | Barbados | 5.0 /100 | #229 | Tragic 30.2% |
| English | 4.8 /100 | #230 | Tragic 30.2% |
| Dutch | 4.3 /100 | #231 | Tragic 30.2% |
| Alaskan Athabascans | 4.1 /100 | #232 | Tragic 30.3% |
| Immigrants | Middle Africa | 3.5 /100 | #233 | Tragic 30.3% |
| Immigrants | Nicaragua | 3.5 /100 | #234 | Tragic 30.3% |
| Immigrants | Grenada | 3.4 /100 | #235 | Tragic 30.3% |
| Welsh | 3.2 /100 | #236 | Tragic 30.4% |