Armenian vs Yakama Single Mother Poverty
COMPARE
Armenian
Yakama
Single Mother Poverty
Single Mother Poverty Comparison
Armenians
Yakama
26.8%
SINGLE MOTHER POVERTY
99.9/ 100
METRIC RATING
42nd/ 347
METRIC RANK
36.4%
SINGLE MOTHER POVERTY
0.0/ 100
METRIC RATING
327th/ 347
METRIC RANK
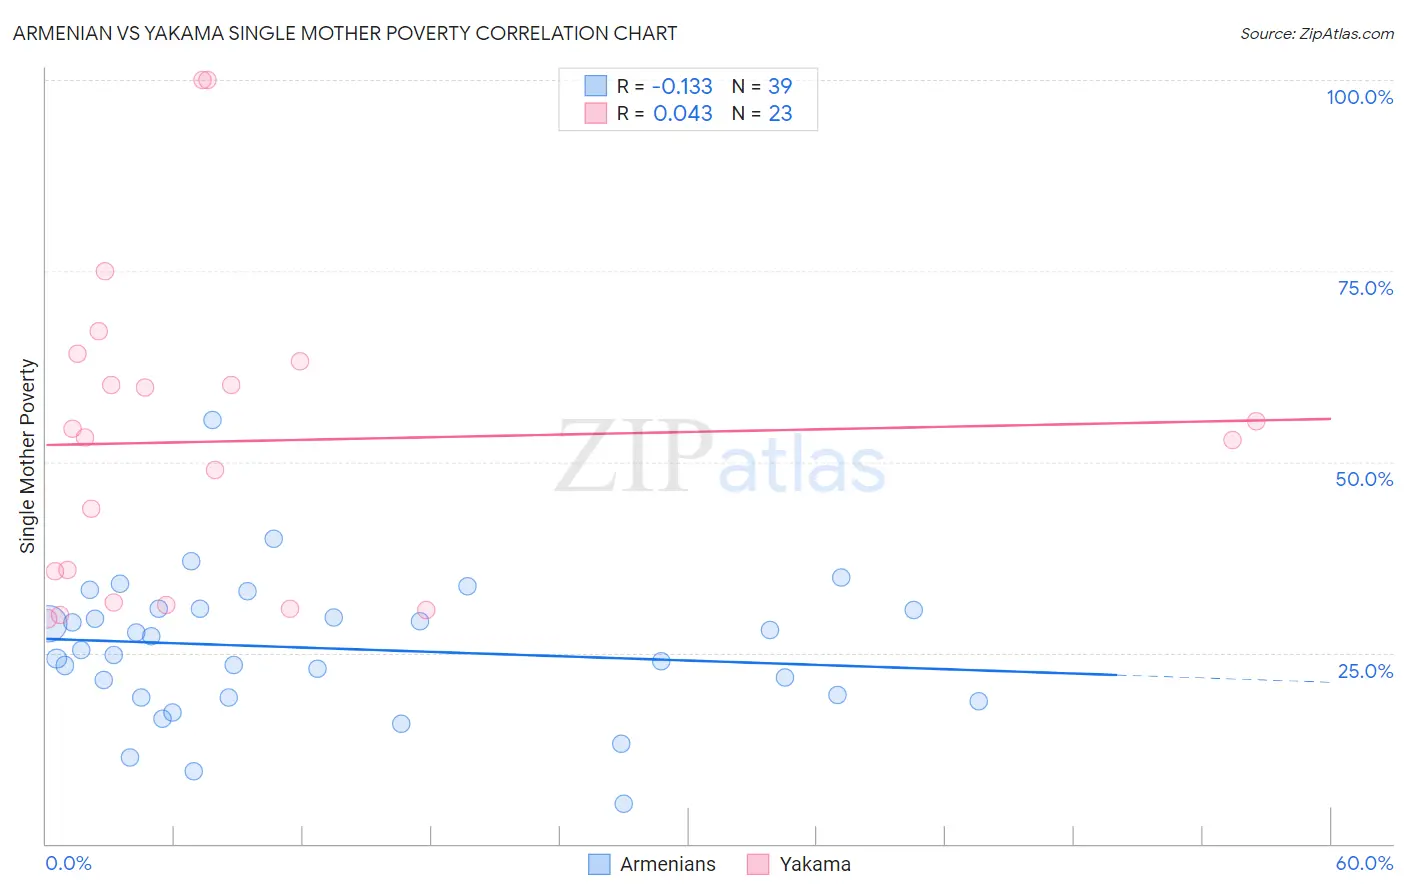
Armenian vs Yakama Single Mother Poverty Correlation Chart
The statistical analysis conducted on geographies consisting of 302,870,774 people shows a poor negative correlation between the proportion of Armenians and poverty level among single mothers in the United States with a correlation coefficient (R) of -0.133 and weighted average of 26.8%. Similarly, the statistical analysis conducted on geographies consisting of 19,786,189 people shows no correlation between the proportion of Yakama and poverty level among single mothers in the United States with a correlation coefficient (R) of 0.043 and weighted average of 36.4%, a difference of 35.8%.
Single Mother Poverty Correlation Summary
| Measurement | Armenian | Yakama |
| Minimum | 5.2% | 29.5% |
| Maximum | 55.5% | 100.0% |
| Range | 50.3% | 70.5% |
| Mean | 25.6% | 52.7% |
| Median | 25.4% | 53.2% |
| Interquartile 25% (IQ1) | 19.2% | 31.6% |
| Interquartile 75% (IQ3) | 30.7% | 63.2% |
| Interquartile Range (IQR) | 11.5% | 31.6% |
| Standard Deviation (Sample) | 9.2% | 20.4% |
| Standard Deviation (Population) | 9.1% | 20.0% |
Similar Demographics by Single Mother Poverty
Demographics Similar to Armenians by Single Mother Poverty
In terms of single mother poverty, the demographic groups most similar to Armenians are Tsimshian (26.8%, a difference of 0.080%), Immigrants from Sierra Leone (26.9%, a difference of 0.22%), Immigrants from Greece (26.7%, a difference of 0.23%), Latvian (26.9%, a difference of 0.29%), and Immigrants from Vietnam (26.7%, a difference of 0.31%).
| Demographics | Rating | Rank | Single Mother Poverty |
| Maltese | 99.9 /100 | #35 | Exceptional 26.6% |
| Okinawans | 99.9 /100 | #36 | Exceptional 26.6% |
| Immigrants | Israel | 99.9 /100 | #37 | Exceptional 26.6% |
| Immigrants | Fiji | 99.9 /100 | #38 | Exceptional 26.6% |
| Sri Lankans | 99.9 /100 | #39 | Exceptional 26.7% |
| Immigrants | Vietnam | 99.9 /100 | #40 | Exceptional 26.7% |
| Immigrants | Greece | 99.9 /100 | #41 | Exceptional 26.7% |
| Armenians | 99.9 /100 | #42 | Exceptional 26.8% |
| Tsimshian | 99.9 /100 | #43 | Exceptional 26.8% |
| Immigrants | Sierra Leone | 99.9 /100 | #44 | Exceptional 26.9% |
| Latvians | 99.9 /100 | #45 | Exceptional 26.9% |
| Immigrants | Serbia | 99.9 /100 | #46 | Exceptional 26.9% |
| Egyptians | 99.8 /100 | #47 | Exceptional 26.9% |
| Immigrants | Poland | 99.8 /100 | #48 | Exceptional 26.9% |
| Cambodians | 99.8 /100 | #49 | Exceptional 27.0% |
Demographics Similar to Yakama by Single Mother Poverty
In terms of single mother poverty, the demographic groups most similar to Yakama are Choctaw (36.4%, a difference of 0.060%), Apache (36.6%, a difference of 0.53%), Native/Alaskan (36.6%, a difference of 0.64%), Creek (36.7%, a difference of 0.79%), and Dutch West Indian (36.8%, a difference of 1.0%).
| Demographics | Rating | Rank | Single Mother Poverty |
| Iroquois | 0.0 /100 | #320 | Tragic 34.8% |
| Paiute | 0.0 /100 | #321 | Tragic 35.1% |
| Blacks/African Americans | 0.0 /100 | #322 | Tragic 35.2% |
| Kiowa | 0.0 /100 | #323 | Tragic 35.5% |
| Ottawa | 0.0 /100 | #324 | Tragic 35.5% |
| Ute | 0.0 /100 | #325 | Tragic 35.7% |
| Seminole | 0.0 /100 | #326 | Tragic 35.8% |
| Yakama | 0.0 /100 | #327 | Tragic 36.4% |
| Choctaw | 0.0 /100 | #328 | Tragic 36.4% |
| Apache | 0.0 /100 | #329 | Tragic 36.6% |
| Natives/Alaskans | 0.0 /100 | #330 | Tragic 36.6% |
| Creek | 0.0 /100 | #331 | Tragic 36.7% |
| Dutch West Indians | 0.0 /100 | #332 | Tragic 36.8% |
| Menominee | 0.0 /100 | #333 | Tragic 37.1% |
| Pueblo | 0.0 /100 | #334 | Tragic 37.2% |