Armenian vs Romanian Single Female Poverty

COMPARE

Armenian
Race
Ancestry
AfghanAfricanAlaska NativeAlaskan AthabascanAlbanianAleutAlsatianAmericanApacheArabArapahoArgentineanArmenianAssyrian/Chaldean/SyriacAustralianAustrianBahamianBangladeshiBarbadianBasqueBelgianBelizeanBermudanBhutaneseBlackfeetBolivianBrazilianBritishBritish West IndianBulgarianBurmeseCajunCambodianCanadianCape VerdeanCarpatho RusynCelticCentral AmericanCentral American IndianCherokeeCheyenneChickasawChileanChineseChippewaChoctawColombianColvilleComancheCosta RicanCreeCreekCroatianCrowCubanCypriotCzechCzechoslovakianDanishDelawareDominicanDutchDutch West IndianEastern EuropeanEcuadorianEgyptianEnglishEstonianEthiopianEuropeanFijianFilipinoFinnishFrenchFrench American IndianFrench CanadianGermanGerman RussianGhanaianGreekGuamanian/ChamorroGuatemalanGuyaneseHaitianHmongHonduranHopiHoumaHungarianIcelanderIndian (Asian)IndonesianInupiatIranianIraqiIrishIroquoisIsraeliItalianJamaicanJapaneseJordanianKenyanKiowaKoreanLaotianLatvianLebaneseLiberianLithuanianLumbeeLuxembourgerMacedonianMalaysianMalteseMarshalleseMenomineeMexicanMexican American IndianMongolianMoroccanNative HawaiianNavajoNepaleseNew ZealanderNicaraguanNigerianNorthern EuropeanNorwegianOkinawanOsageOttawaPaiutePakistaniPalestinianPanamanianParaguayanPennsylvania GermanPeruvianPimaPolishPortuguesePotawatomiPuebloPuerto RicanPuget Sound SalishRussianSalvadoranSamoanScandinavianScotch-IrishScottishSeminoleSenegaleseSerbianShoshoneSierra LeoneanSiouxSlavicSlovakSloveneSomaliSouth AfricanSouth AmericanSouth American IndianSoviet UnionSpaniardSpanishSpanish AmericanSpanish American IndianSri LankanSubsaharan AfricanSudaneseSwedishSwissSyrianTaiwaneseThaiTlingit-HaidaTohono O'OdhamTonganTrinidadian and TobagonianTsimshianTurkishU.S. Virgin IslanderUgandanUkrainianUruguayanUteVenezuelanVietnameseWelshWest IndianYakamaYaquiYugoslavianYumanYup'ikZimbabwean
Immigration
NonimmigrantsImmigrantsAfghanistanAfricaAlbaniaArgentinaArmeniaAsiaAustraliaAustriaBahamasBangladeshBarbadosBelarusBelgiumBelizeBoliviaBosnia and HerzegovinaBrazilBulgariaBurma/MyanmarCabo VerdeCambodiaCameroonCanadaCaribbeanCentral AmericaChileChinaColombiaCongoCosta RicaCroatiaCubaCzechoslovakiaDenmarkDominicaDominican RepublicEastern AfricaEastern AsiaEastern EuropeEcuadorEgyptEl SalvadorEnglandEritreaEthiopiaEuropeFijiFranceGermanyGhanaGreeceGrenadaGuatemalaGuyanaHaitiHondurasHong KongHungaryIndiaIndonesiaIranIraqIrelandIsraelItalyJamaicaJapanJordanKazakhstanKenyaKoreaKuwaitLaosLatin AmericaLatviaLebanonLiberiaLithuaniaMalaysiaMexicoMicronesiaMiddle AfricaMoldovaMoroccoNepalNetherlandsNicaraguaNigeriaNorth AmericaNorth MacedoniaNorthern AfricaNorthern EuropeNorwayOceaniaPakistanPanamaPeruPhilippinesPolandPortugalRomaniaRussiaSaudi ArabiaScotlandSenegalSerbiaSierra LeoneSingaporeSomaliaSouth AfricaSouth AmericaSouth Central AsiaSouth Eastern AsiaSouthern EuropeSpainSri LankaSt. Vincent and the GrenadinesSudanSwedenSwitzerlandSyriaTaiwanThailandTrinidad and TobagoTurkeyUgandaUkraineUruguayUzbekistanVenezuelaVietnamWest IndiesWestern AfricaWestern AsiaWestern EuropeYemenZaireZimbabweAzores
Romanian
Race
Ancestry
AfghanAfricanAlaska NativeAlaskan AthabascanAlbanianAleutAlsatianAmericanApacheArabArapahoArgentineanAssyrian/Chaldean/SyriacAustralianAustrianBahamianBangladeshiBarbadianBasqueBelgianBelizeanBermudanBhutaneseBlackfeetBolivianBrazilianBritishBritish West IndianBulgarianBurmeseCajunCambodianCanadianCape VerdeanCarpatho RusynCelticCentral AmericanCentral American IndianCherokeeCheyenneChickasawChileanChineseChippewaChoctawColombianColvilleComancheCosta RicanCreeCreekCroatianCrowCubanCypriotCzechCzechoslovakianDanishDelawareDominicanDutchDutch West IndianEastern EuropeanEcuadorianEgyptianEnglishEstonianEthiopianEuropeanFijianFilipinoFinnishFrenchFrench American IndianFrench CanadianGermanGerman RussianGhanaianGreekGuamanian/ChamorroGuatemalanGuyaneseHaitianHmongHonduranHopiHoumaHungarianIcelanderIndian (Asian)IndonesianInupiatIranianIraqiIrishIroquoisIsraeliItalianJamaicanJapaneseJordanianKenyanKiowaKoreanLaotianLatvianLebaneseLiberianLithuanianLumbeeLuxembourgerMacedonianMalaysianMalteseMarshalleseMenomineeMexicanMexican American IndianMongolianMoroccanNative HawaiianNavajoNepaleseNew ZealanderNicaraguanNigerianNorthern EuropeanNorwegianOkinawanOsageOttawaPaiutePakistaniPalestinianPanamanianParaguayanPennsylvania GermanPeruvianPimaPolishPortuguesePotawatomiPuebloPuerto RicanPuget Sound SalishRomanianRussianSalvadoranSamoanScandinavianScotch-IrishScottishSeminoleSenegaleseSerbianShoshoneSierra LeoneanSiouxSlavicSlovakSloveneSomaliSouth AfricanSouth AmericanSouth American IndianSoviet UnionSpaniardSpanishSpanish AmericanSpanish American IndianSri LankanSubsaharan AfricanSudaneseSwedishSwissSyrianTaiwaneseThaiTlingit-HaidaTohono O'OdhamTonganTrinidadian and TobagonianTsimshianTurkishU.S. Virgin IslanderUgandanUkrainianUruguayanUteVenezuelanVietnameseWelshWest IndianYakamaYaquiYugoslavianYumanYup'ikZimbabwean
Immigration
NonimmigrantsImmigrantsAfghanistanAfricaAlbaniaArgentinaArmeniaAsiaAustraliaAustriaBahamasBangladeshBarbadosBelarusBelgiumBelizeBoliviaBosnia and HerzegovinaBrazilBulgariaBurma/MyanmarCabo VerdeCambodiaCameroonCanadaCaribbeanCentral AmericaChileChinaColombiaCongoCosta RicaCroatiaCubaCzechoslovakiaDenmarkDominicaDominican RepublicEastern AfricaEastern AsiaEastern EuropeEcuadorEgyptEl SalvadorEnglandEritreaEthiopiaEuropeFijiFranceGermanyGhanaGreeceGrenadaGuatemalaGuyanaHaitiHondurasHong KongHungaryIndiaIndonesiaIranIraqIrelandIsraelItalyJamaicaJapanJordanKazakhstanKenyaKoreaKuwaitLaosLatin AmericaLatviaLebanonLiberiaLithuaniaMalaysiaMexicoMicronesiaMiddle AfricaMoldovaMoroccoNepalNetherlandsNicaraguaNigeriaNorth AmericaNorth MacedoniaNorthern AfricaNorthern EuropeNorwayOceaniaPakistanPanamaPeruPhilippinesPolandPortugalRomaniaRussiaSaudi ArabiaScotlandSenegalSerbiaSierra LeoneSingaporeSomaliaSouth AfricaSouth AmericaSouth Central AsiaSouth Eastern AsiaSouthern EuropeSpainSri LankaSt. Vincent and the GrenadinesSudanSwedenSwitzerlandSyriaTaiwanThailandTrinidad and TobagoTurkeyUgandaUkraineUruguayUzbekistanVenezuelaVietnamWest IndiesWestern AfricaWestern AsiaWestern EuropeYemenZaireZimbabweAzores
Single Female Poverty
Income
Poverty
Unemployment
Labor Participation
Family Structure
Vehicle Availability
Education Level
Disability

Single Female Poverty Comparison

Armenians

Romanians

Exceptional
Exceptional
18.3%
SINGLE FEMALE POVERTY
100.0/ 100
METRIC RATING
24th/ 347
METRIC RANK
19.6%
SINGLE FEMALE POVERTY
98.6/ 100
METRIC RATING
94th/ 347
METRIC RANK

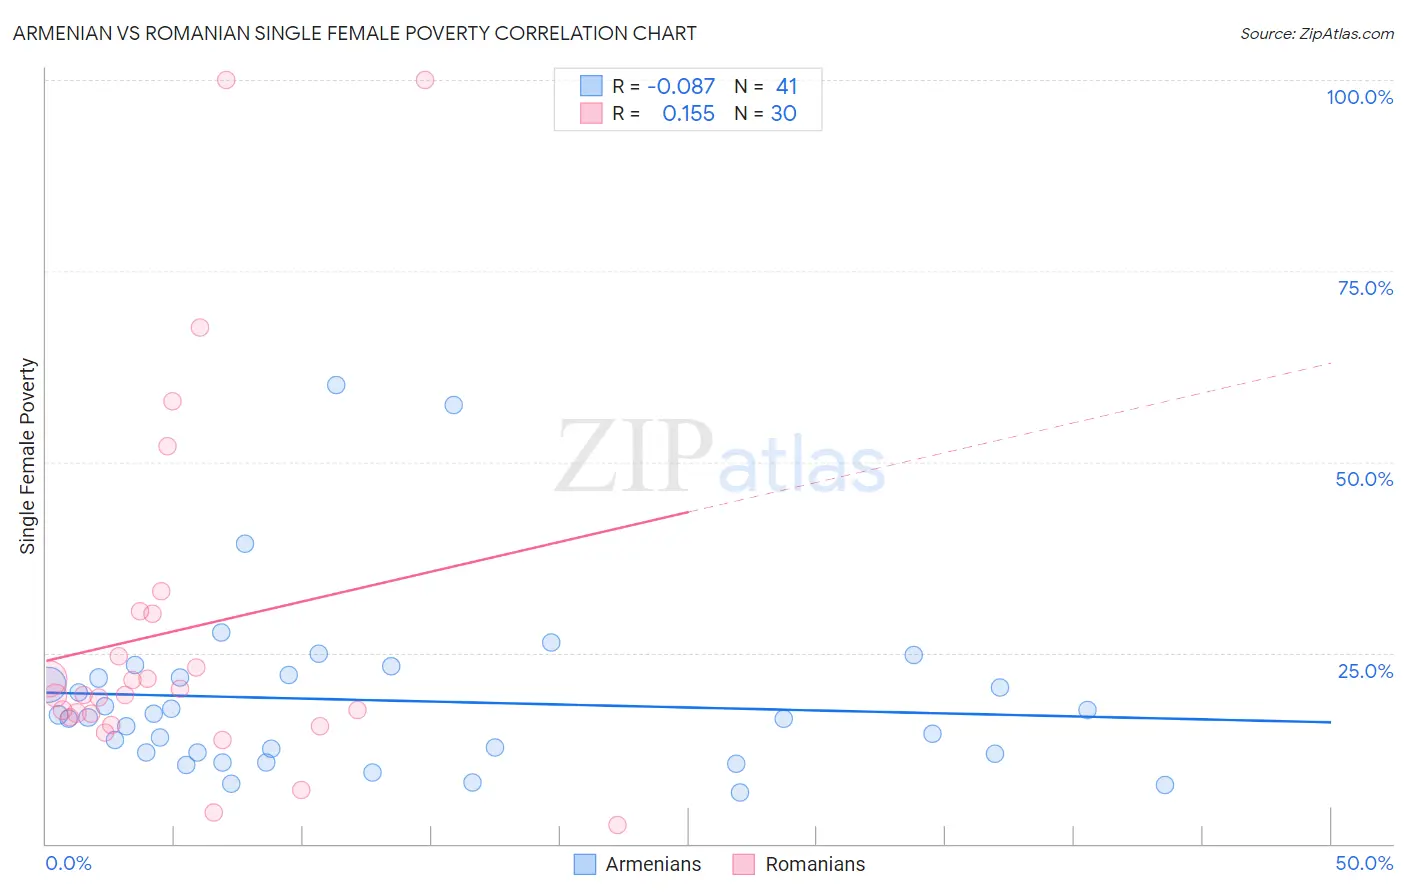
Armenian vs Romanian Single Female Poverty Correlation Chart

The statistical analysis conducted on geographies consisting of 305,765,462 people shows a slight negative correlation between the proportion of Armenians and poverty level among single females in the United States with a correlation coefficient (R) of -0.087 and weighted average of 18.3%. Similarly, the statistical analysis conducted on geographies consisting of 371,309,640 people shows a poor positive correlation between the proportion of Romanians and poverty level among single females in the United States with a correlation coefficient (R) of 0.155 and weighted average of 19.6%, a difference of 7.1%.
Armenian vs Romanian Single Female Poverty

Single Female Poverty Correlation Summary

MeasurementArmenianRomanian
Minimum6.7%2.5%
Maximum60.0%100.0%
Range53.3%97.5%
Mean18.8%28.0%
Median16.5%19.5%
Interquartile 25% (IQ1)11.9%16.6%
Interquartile 75% (IQ3)21.9%30.1%
Interquartile Range (IQR)10.1%13.5%
Standard Deviation (Sample)11.3%24.2%
Standard Deviation (Population)11.1%23.7%

Similar Demographics by Single Female Poverty

Demographics Similar to Armenians by Single Female Poverty

In terms of single female poverty, the demographic groups most similar to Armenians are Immigrants from Singapore (18.3%, a difference of 0.10%), Immigrants from Israel (18.3%, a difference of 0.12%), Burmese (18.3%, a difference of 0.23%), Asian (18.3%, a difference of 0.23%), and Maltese (18.3%, a difference of 0.24%).
DemographicsRating | RankSingle Female Poverty
Immigrants | Korea
100.0
/100
|
#17
Exceptional
18.1%
Immigrants | Eastern Asia
100.0
/100
|
#18
Exceptional
18.1%
Immigrants | China
100.0
/100
|
#19
Exceptional
18.1%
Immigrants | Greece
100.0
/100
|
#20
Exceptional
18.3%
Maltese
100.0
/100
|
#21
Exceptional
18.3%
Burmese
100.0
/100
|
#22
Exceptional
18.3%
Asians
100.0
/100
|
#23
Exceptional
18.3%
Armenians
100.0
/100
|
#24
Exceptional
18.3%
Immigrants | Singapore
100.0
/100
|
#25
Exceptional
18.3%
Immigrants | Israel
100.0
/100
|
#26
Exceptional
18.3%
Immigrants | Pakistan
100.0
/100
|
#27
Exceptional
18.4%
Immigrants | Moldova
100.0
/100
|
#28
Exceptional
18.5%
Immigrants | Poland
100.0
/100
|
#29
Exceptional
18.5%
Immigrants | North Macedonia
99.9
/100
|
#30
Exceptional
18.5%
Immigrants | Asia
99.9
/100
|
#31
Exceptional
18.6%

Demographics Similar to Romanians by Single Female Poverty

In terms of single female poverty, the demographic groups most similar to Romanians are Immigrants from Austria (19.6%, a difference of 0.22%), Italian (19.6%, a difference of 0.23%), Soviet Union (19.6%, a difference of 0.28%), Immigrants from Lebanon (19.6%, a difference of 0.34%), and Estonian (19.7%, a difference of 0.38%).
DemographicsRating | RankSingle Female Poverty
Zimbabweans
99.0
/100
|
#87
Exceptional
19.5%
Afghans
99.0
/100
|
#88
Exceptional
19.5%
Immigrants | Ukraine
99.0
/100
|
#89
Exceptional
19.5%
Immigrants | Lebanon
98.8
/100
|
#90
Exceptional
19.6%
Soviet Union
98.8
/100
|
#91
Exceptional
19.6%
Italians
98.8
/100
|
#92
Exceptional
19.6%
Immigrants | Austria
98.8
/100
|
#93
Exceptional
19.6%
Romanians
98.6
/100
|
#94
Exceptional
19.6%
Estonians
98.2
/100
|
#95
Exceptional
19.7%
Immigrants | Brazil
98.2
/100
|
#96
Exceptional
19.7%
Croatians
98.1
/100
|
#97
Exceptional
19.7%
Immigrants | France
97.9
/100
|
#98
Exceptional
19.7%
Sierra Leoneans
97.9
/100
|
#99
Exceptional
19.7%
Ukrainians
97.6
/100
|
#100
Exceptional
19.8%
Immigrants | Belgium
97.3
/100
|
#101
Exceptional
19.8%