Armenian vs Icelander Child Poverty Under the Age of 16
COMPARE
Armenian
Icelander
Child Poverty Under the Age of 16
Child Poverty Under the Age of 16 Comparison
Armenians
Icelanders
15.2%
CHILD POVERTY UNDER THE AGE OF 16
89.4/ 100
METRIC RATING
131st/ 347
METRIC RANK
15.4%
CHILD POVERTY UNDER THE AGE OF 16
82.5/ 100
METRIC RATING
143rd/ 347
METRIC RANK
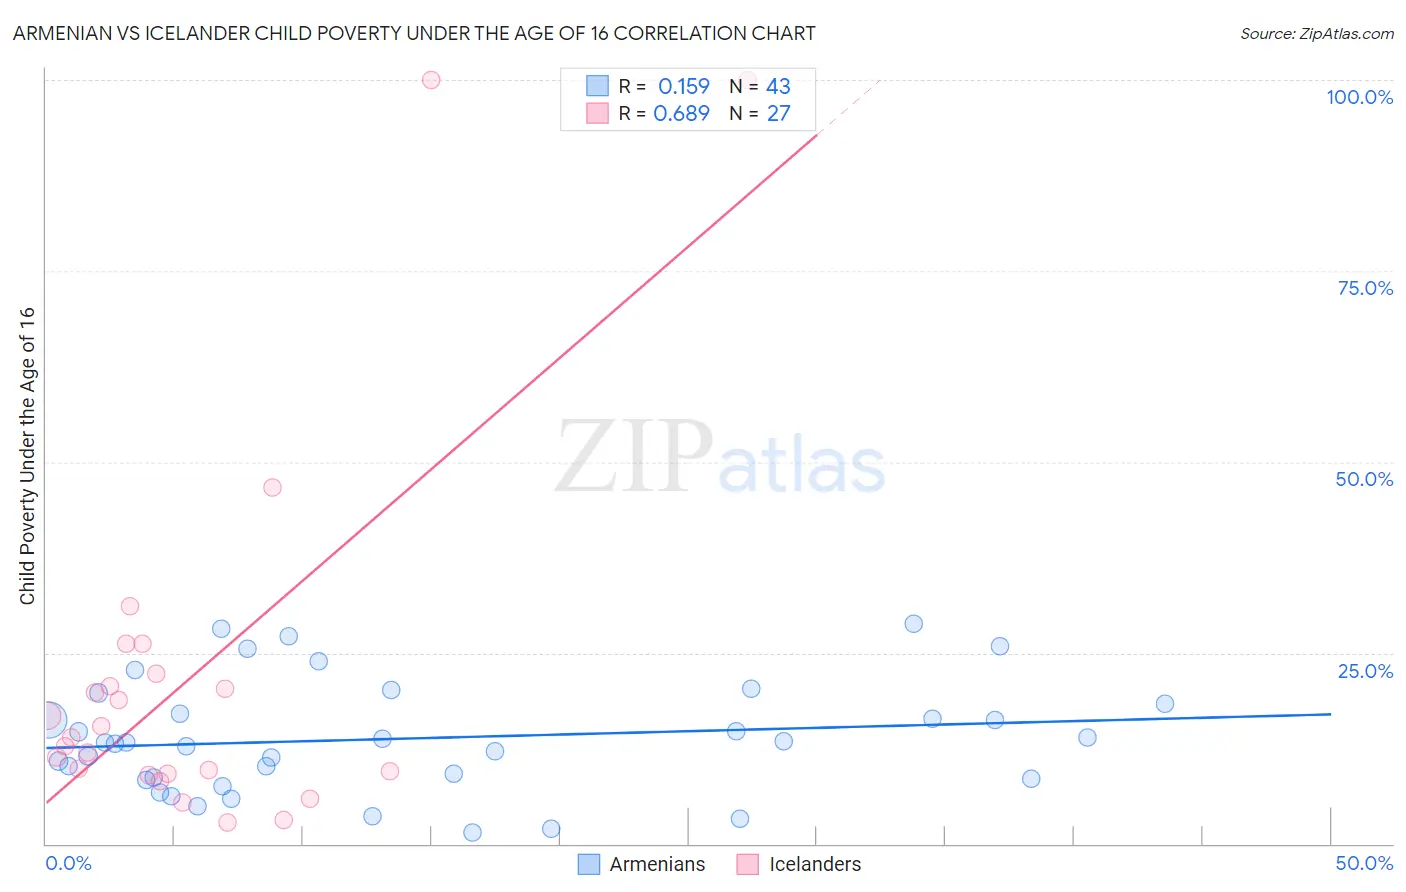
Armenian vs Icelander Child Poverty Under the Age of 16 Correlation Chart
The statistical analysis conducted on geographies consisting of 307,876,845 people shows a poor positive correlation between the proportion of Armenians and poverty level among children under the age of 16 in the United States with a correlation coefficient (R) of 0.159 and weighted average of 15.2%. Similarly, the statistical analysis conducted on geographies consisting of 158,777,342 people shows a significant positive correlation between the proportion of Icelanders and poverty level among children under the age of 16 in the United States with a correlation coefficient (R) of 0.689 and weighted average of 15.4%, a difference of 1.9%.
Child Poverty Under the Age of 16 Correlation Summary
| Measurement | Armenian | Icelander |
| Minimum | 1.5% | 2.9% |
| Maximum | 28.8% | 100.0% |
| Range | 27.3% | 97.1% |
| Mean | 13.8% | 21.7% |
| Median | 13.2% | 14.0% |
| Interquartile 25% (IQ1) | 8.6% | 9.1% |
| Interquartile 75% (IQ3) | 18.3% | 22.2% |
| Interquartile Range (IQR) | 9.8% | 13.1% |
| Standard Deviation (Sample) | 7.2% | 24.5% |
| Standard Deviation (Population) | 7.2% | 24.0% |
Demographics Similar to Armenians and Icelanders by Child Poverty Under the Age of 16
In terms of child poverty under the age of 16, the demographic groups most similar to Armenians are Mongolian (15.2%, a difference of 0.030%), Canadian (15.2%, a difference of 0.090%), Immigrants from Southern Europe (15.1%, a difference of 0.12%), Immigrants from South Eastern Asia (15.2%, a difference of 0.14%), and Native Hawaiian (15.2%, a difference of 0.23%). Similarly, the demographic groups most similar to Icelanders are Brazilian (15.4%, a difference of 0.070%), Immigrants from Hungary (15.5%, a difference of 0.12%), Immigrants from Peru (15.5%, a difference of 0.17%), Slovak (15.5%, a difference of 0.21%), and Slavic (15.4%, a difference of 0.41%).
| Demographics | Rating | Rank | Child Poverty Under the Age of 16 |
| Immigrants | Western Europe | 90.3 /100 | #127 | Exceptional 15.1% |
| Immigrants | Kazakhstan | 90.2 /100 | #128 | Exceptional 15.1% |
| Immigrants | Southern Europe | 89.7 /100 | #129 | Excellent 15.1% |
| Mongolians | 89.5 /100 | #130 | Excellent 15.2% |
| Armenians | 89.4 /100 | #131 | Excellent 15.2% |
| Canadians | 89.1 /100 | #132 | Excellent 15.2% |
| Immigrants | South Eastern Asia | 89.0 /100 | #133 | Excellent 15.2% |
| Native Hawaiians | 88.7 /100 | #134 | Excellent 15.2% |
| Albanians | 88.6 /100 | #135 | Excellent 15.2% |
| Immigrants | Spain | 87.3 /100 | #136 | Excellent 15.3% |
| Peruvians | 87.2 /100 | #137 | Excellent 15.3% |
| Welsh | 87.2 /100 | #138 | Excellent 15.3% |
| Immigrants | Vietnam | 87.1 /100 | #139 | Excellent 15.3% |
| New Zealanders | 86.9 /100 | #140 | Excellent 15.3% |
| Slavs | 84.2 /100 | #141 | Excellent 15.4% |
| Brazilians | 82.8 /100 | #142 | Excellent 15.4% |
| Icelanders | 82.5 /100 | #143 | Excellent 15.4% |
| Immigrants | Hungary | 81.9 /100 | #144 | Excellent 15.5% |
| Immigrants | Peru | 81.7 /100 | #145 | Excellent 15.5% |
| Slovaks | 81.4 /100 | #146 | Excellent 15.5% |
| Immigrants | Kuwait | 80.5 /100 | #147 | Excellent 15.5% |