Argentinean vs Immigrants from Honduras Seniors Poverty Over the Age of 65
COMPARE
Argentinean
Immigrants from Honduras
Seniors Poverty Over the Age of 65
Seniors Poverty Over the Age of 65 Comparison
Argentineans
Immigrants from Honduras
11.7%
SENIORS POVERTY OVER THE AGE OF 65
4.1/ 100
METRIC RATING
221st/ 347
METRIC RANK
14.5%
SENIORS POVERTY OVER THE AGE OF 65
0.0/ 100
METRIC RATING
318th/ 347
METRIC RANK
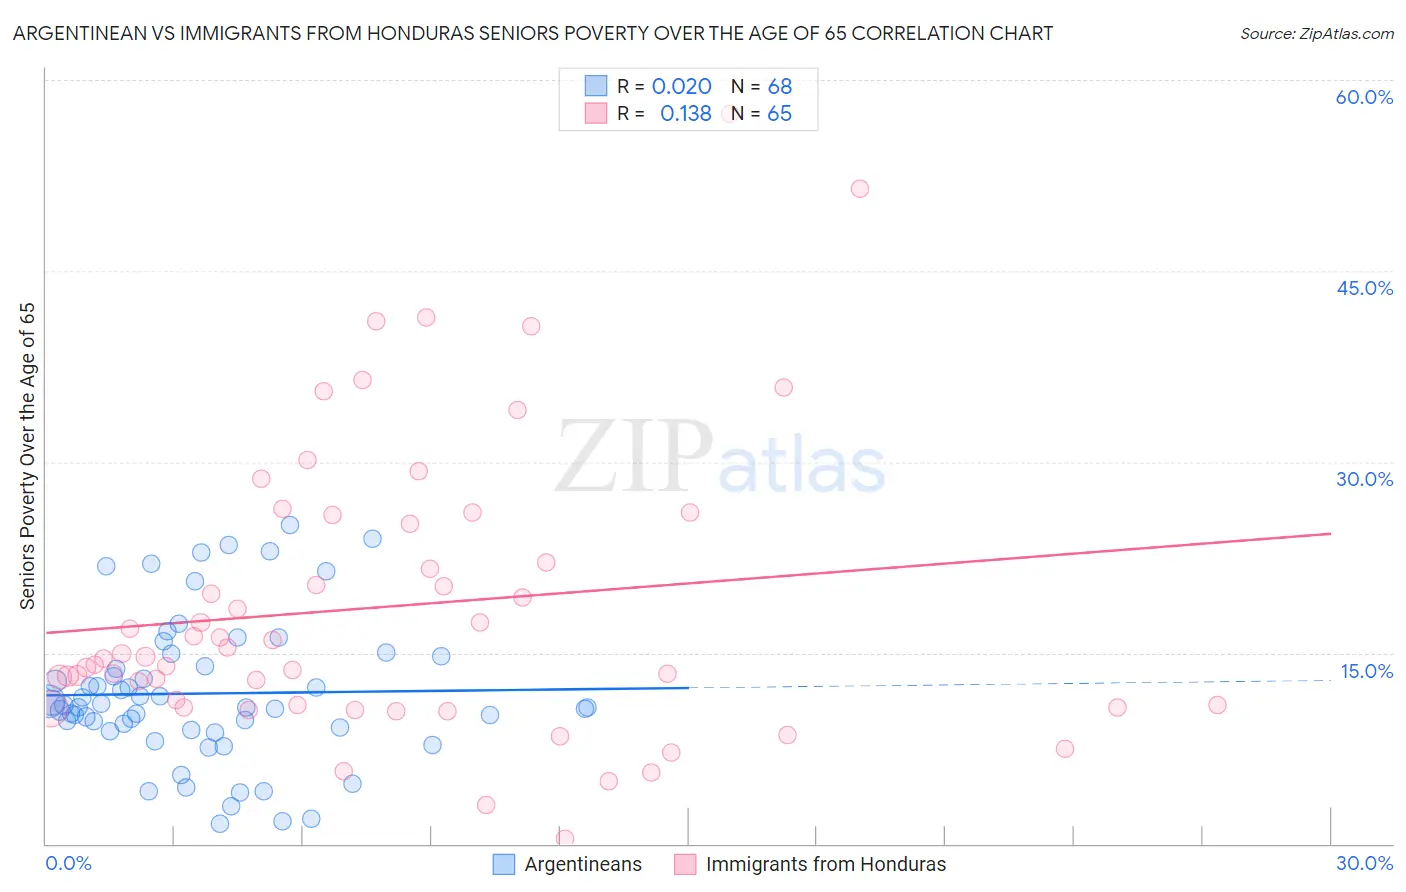
Argentinean vs Immigrants from Honduras Seniors Poverty Over the Age of 65 Correlation Chart
The statistical analysis conducted on geographies consisting of 296,547,571 people shows no correlation between the proportion of Argentineans and poverty level among seniors over the age of 65 in the United States with a correlation coefficient (R) of 0.020 and weighted average of 11.7%. Similarly, the statistical analysis conducted on geographies consisting of 322,012,032 people shows a poor positive correlation between the proportion of Immigrants from Honduras and poverty level among seniors over the age of 65 in the United States with a correlation coefficient (R) of 0.138 and weighted average of 14.5%, a difference of 23.8%.
Seniors Poverty Over the Age of 65 Correlation Summary
| Measurement | Argentinean | Immigrants from Honduras |
| Minimum | 1.5% | 0.43% |
| Maximum | 25.0% | 57.4% |
| Range | 23.5% | 57.0% |
| Mean | 11.8% | 18.6% |
| Median | 10.8% | 14.7% |
| Interquartile 25% (IQ1) | 9.0% | 10.8% |
| Interquartile 75% (IQ3) | 14.3% | 25.5% |
| Interquartile Range (IQR) | 5.3% | 14.7% |
| Standard Deviation (Sample) | 5.6% | 11.5% |
| Standard Deviation (Population) | 5.5% | 11.4% |
Similar Demographics by Seniors Poverty Over the Age of 65
Demographics Similar to Argentineans by Seniors Poverty Over the Age of 65
In terms of seniors poverty over the age of 65, the demographic groups most similar to Argentineans are Peruvian (11.7%, a difference of 0.070%), Immigrants from Chile (11.7%, a difference of 0.12%), Immigrants from Congo (11.7%, a difference of 0.15%), Immigrants from Nigeria (11.7%, a difference of 0.39%), and Immigrants from Belarus (11.8%, a difference of 0.49%).
| Demographics | Rating | Rank | Seniors Poverty Over the Age of 65 |
| Immigrants | Russia | 8.8 /100 | #214 | Tragic 11.5% |
| French American Indians | 8.7 /100 | #215 | Tragic 11.5% |
| Immigrants | Morocco | 6.8 /100 | #216 | Tragic 11.6% |
| Immigrants | Africa | 6.4 /100 | #217 | Tragic 11.6% |
| Immigrants | Ukraine | 5.7 /100 | #218 | Tragic 11.6% |
| Arapaho | 5.2 /100 | #219 | Tragic 11.6% |
| Peruvians | 4.2 /100 | #220 | Tragic 11.7% |
| Argentineans | 4.1 /100 | #221 | Tragic 11.7% |
| Immigrants | Chile | 3.9 /100 | #222 | Tragic 11.7% |
| Immigrants | Congo | 3.8 /100 | #223 | Tragic 11.7% |
| Immigrants | Nigeria | 3.4 /100 | #224 | Tragic 11.7% |
| Immigrants | Belarus | 3.2 /100 | #225 | Tragic 11.8% |
| Liberians | 3.2 /100 | #226 | Tragic 11.8% |
| Nigerians | 3.2 /100 | #227 | Tragic 11.8% |
| Immigrants | Costa Rica | 2.7 /100 | #228 | Tragic 11.8% |
Demographics Similar to Immigrants from Honduras by Seniors Poverty Over the Age of 65
In terms of seniors poverty over the age of 65, the demographic groups most similar to Immigrants from Honduras are Haitian (14.5%, a difference of 0.21%), Immigrants from Guyana (14.5%, a difference of 0.24%), Immigrants from Ecuador (14.4%, a difference of 0.45%), Guyanese (14.4%, a difference of 0.49%), and Barbadian (14.4%, a difference of 0.88%).
| Demographics | Rating | Rank | Seniors Poverty Over the Age of 65 |
| Natives/Alaskans | 0.0 /100 | #311 | Tragic 14.2% |
| Hispanics or Latinos | 0.0 /100 | #312 | Tragic 14.3% |
| Barbadians | 0.0 /100 | #313 | Tragic 14.4% |
| Guyanese | 0.0 /100 | #314 | Tragic 14.4% |
| Immigrants | Ecuador | 0.0 /100 | #315 | Tragic 14.4% |
| Immigrants | Guyana | 0.0 /100 | #316 | Tragic 14.5% |
| Haitians | 0.0 /100 | #317 | Tragic 14.5% |
| Immigrants | Honduras | 0.0 /100 | #318 | Tragic 14.5% |
| Cape Verdeans | 0.0 /100 | #319 | Tragic 14.7% |
| Immigrants | Haiti | 0.0 /100 | #320 | Tragic 14.7% |
| Houma | 0.0 /100 | #321 | Tragic 14.7% |
| Immigrants | Barbados | 0.0 /100 | #322 | Tragic 14.8% |
| Yakama | 0.0 /100 | #323 | Tragic 14.8% |
| Nicaraguans | 0.0 /100 | #324 | Tragic 15.0% |
| Central American Indians | 0.0 /100 | #325 | Tragic 15.1% |