Argentinean vs Immigrants from Greece Single Male Poverty

COMPARE

Argentinean
Race
Ancestry
AfghanAfricanAlaska NativeAlaskan AthabascanAlbanianAleutAlsatianAmericanApacheArabArapahoArgentineanArmenianAssyrian/Chaldean/SyriacAustralianAustrianBahamianBangladeshiBarbadianBasqueBelgianBelizeanBermudanBhutaneseBlackfeetBolivianBrazilianBritishBritish West IndianBulgarianBurmeseCajunCambodianCanadianCape VerdeanCarpatho RusynCelticCentral AmericanCentral American IndianCherokeeCheyenneChickasawChileanChineseChippewaChoctawColombianColvilleComancheCosta RicanCreeCreekCroatianCrowCubanCypriotCzechCzechoslovakianDanishDelawareDominicanDutchDutch West IndianEastern EuropeanEcuadorianEgyptianEnglishEstonianEthiopianEuropeanFijianFilipinoFinnishFrenchFrench American IndianFrench CanadianGermanGerman RussianGhanaianGreekGuamanian/ChamorroGuatemalanGuyaneseHaitianHmongHonduranHopiHoumaHungarianIcelanderIndian (Asian)IndonesianInupiatIranianIraqiIrishIroquoisIsraeliItalianJamaicanJapaneseJordanianKenyanKiowaKoreanLaotianLatvianLebaneseLiberianLithuanianLumbeeLuxembourgerMacedonianMalaysianMalteseMarshalleseMenomineeMexicanMexican American IndianMongolianMoroccanNative HawaiianNavajoNepaleseNew ZealanderNicaraguanNigerianNorthern EuropeanNorwegianOkinawanOsageOttawaPaiutePakistaniPalestinianPanamanianParaguayanPennsylvania GermanPeruvianPimaPolishPortuguesePotawatomiPuebloPuerto RicanPuget Sound SalishRomanianRussianSalvadoranSamoanScandinavianScotch-IrishScottishSeminoleSenegaleseSerbianShoshoneSierra LeoneanSiouxSlavicSlovakSloveneSomaliSouth AfricanSouth AmericanSouth American IndianSoviet UnionSpaniardSpanishSpanish AmericanSpanish American IndianSri LankanSubsaharan AfricanSudaneseSwedishSwissSyrianTaiwaneseThaiTlingit-HaidaTohono O'OdhamTonganTrinidadian and TobagonianTsimshianTurkishU.S. Virgin IslanderUgandanUkrainianUruguayanUteVenezuelanVietnameseWelshWest IndianYakamaYaquiYugoslavianYumanYup'ikZimbabwean
Immigration
NonimmigrantsImmigrantsAfghanistanAfricaAlbaniaArgentinaArmeniaAsiaAustraliaAustriaBahamasBangladeshBarbadosBelarusBelgiumBelizeBoliviaBosnia and HerzegovinaBrazilBulgariaBurma/MyanmarCabo VerdeCambodiaCameroonCanadaCaribbeanCentral AmericaChileChinaColombiaCongoCosta RicaCroatiaCubaCzechoslovakiaDenmarkDominicaDominican RepublicEastern AfricaEastern AsiaEastern EuropeEcuadorEgyptEl SalvadorEnglandEritreaEthiopiaEuropeFijiFranceGermanyGhanaGrenadaGuatemalaGuyanaHaitiHondurasHong KongHungaryIndiaIndonesiaIranIraqIrelandIsraelItalyJamaicaJapanJordanKazakhstanKenyaKoreaKuwaitLaosLatin AmericaLatviaLebanonLiberiaLithuaniaMalaysiaMexicoMicronesiaMiddle AfricaMoldovaMoroccoNepalNetherlandsNicaraguaNigeriaNorth AmericaNorth MacedoniaNorthern AfricaNorthern EuropeNorwayOceaniaPakistanPanamaPeruPhilippinesPolandPortugalRomaniaRussiaSaudi ArabiaScotlandSenegalSerbiaSierra LeoneSingaporeSomaliaSouth AfricaSouth AmericaSouth Central AsiaSouth Eastern AsiaSouthern EuropeSpainSri LankaSt. Vincent and the GrenadinesSudanSwedenSwitzerlandSyriaTaiwanThailandTrinidad and TobagoTurkeyUgandaUkraineUruguayUzbekistanVenezuelaVietnamWest IndiesWestern AfricaWestern AsiaWestern EuropeYemenZaireZimbabweAzores
Immigrants from Greece
Race
Ancestry
AfghanAfricanAlaska NativeAlaskan AthabascanAlbanianAleutAlsatianAmericanApacheArabArapahoArmenianAssyrian/Chaldean/SyriacAustralianAustrianBahamianBangladeshiBarbadianBasqueBelgianBelizeanBermudanBhutaneseBlackfeetBolivianBrazilianBritishBritish West IndianBulgarianBurmeseCajunCambodianCanadianCape VerdeanCarpatho RusynCelticCentral AmericanCentral American IndianCherokeeCheyenneChickasawChileanChineseChippewaChoctawColombianColvilleComancheCosta RicanCreeCreekCroatianCrowCubanCypriotCzechCzechoslovakianDanishDelawareDominicanDutchDutch West IndianEastern EuropeanEcuadorianEgyptianEnglishEstonianEthiopianEuropeanFijianFilipinoFinnishFrenchFrench American IndianFrench CanadianGermanGerman RussianGhanaianGreekGuamanian/ChamorroGuatemalanGuyaneseHaitianHmongHonduranHopiHoumaHungarianIcelanderIndian (Asian)IndonesianInupiatIranianIraqiIrishIroquoisIsraeliItalianJamaicanJapaneseJordanianKenyanKiowaKoreanLaotianLatvianLebaneseLiberianLithuanianLumbeeLuxembourgerMacedonianMalaysianMalteseMarshalleseMenomineeMexicanMexican American IndianMongolianMoroccanNative HawaiianNavajoNepaleseNew ZealanderNicaraguanNigerianNorthern EuropeanNorwegianOkinawanOsageOttawaPaiutePakistaniPalestinianPanamanianParaguayanPennsylvania GermanPeruvianPimaPolishPortuguesePotawatomiPuebloPuerto RicanPuget Sound SalishRomanianRussianSalvadoranSamoanScandinavianScotch-IrishScottishSeminoleSenegaleseSerbianShoshoneSierra LeoneanSiouxSlavicSlovakSloveneSomaliSouth AfricanSouth AmericanSouth American IndianSoviet UnionSpaniardSpanishSpanish AmericanSpanish American IndianSri LankanSubsaharan AfricanSudaneseSwedishSwissSyrianTaiwaneseThaiTlingit-HaidaTohono O'OdhamTonganTrinidadian and TobagonianTsimshianTurkishU.S. Virgin IslanderUgandanUkrainianUruguayanUteVenezuelanVietnameseWelshWest IndianYakamaYaquiYugoslavianYumanYup'ikZimbabwean
Immigration
NonimmigrantsImmigrantsAfghanistanAfricaAlbaniaArgentinaArmeniaAsiaAustraliaAustriaBahamasBangladeshBarbadosBelarusBelgiumBelizeBoliviaBosnia and HerzegovinaBrazilBulgariaBurma/MyanmarCabo VerdeCambodiaCameroonCanadaCaribbeanCentral AmericaChileChinaColombiaCongoCosta RicaCroatiaCubaCzechoslovakiaDenmarkDominicaDominican RepublicEastern AfricaEastern AsiaEastern EuropeEcuadorEgyptEl SalvadorEnglandEritreaEthiopiaEuropeFijiFranceGermanyGhanaGreeceGrenadaGuatemalaGuyanaHaitiHondurasHong KongHungaryIndiaIndonesiaIranIraqIrelandIsraelItalyJamaicaJapanJordanKazakhstanKenyaKoreaKuwaitLaosLatin AmericaLatviaLebanonLiberiaLithuaniaMalaysiaMexicoMicronesiaMiddle AfricaMoldovaMoroccoNepalNetherlandsNicaraguaNigeriaNorth AmericaNorth MacedoniaNorthern AfricaNorthern EuropeNorwayOceaniaPakistanPanamaPeruPhilippinesPolandPortugalRomaniaRussiaSaudi ArabiaScotlandSenegalSerbiaSierra LeoneSingaporeSomaliaSouth AfricaSouth AmericaSouth Central AsiaSouth Eastern AsiaSouthern EuropeSpainSri LankaSt. Vincent and the GrenadinesSudanSwedenSwitzerlandSyriaTaiwanThailandTrinidad and TobagoTurkeyUgandaUkraineUruguayUzbekistanVenezuelaVietnamWest IndiesWestern AfricaWestern AsiaWestern EuropeYemenZaireZimbabweAzores
Single Male Poverty
Income
Poverty
Unemployment
Labor Participation
Family Structure
Vehicle Availability
Education Level
Disability

Single Male Poverty Comparison

Argentineans

Immigrants from Greece

Exceptional
Exceptional
11.9%
SINGLE MALE POVERTY
99.5/ 100
METRIC RATING
73rd/ 347
METRIC RANK
11.9%
SINGLE MALE POVERTY
99.6/ 100
METRIC RATING
71st/ 347
METRIC RANK

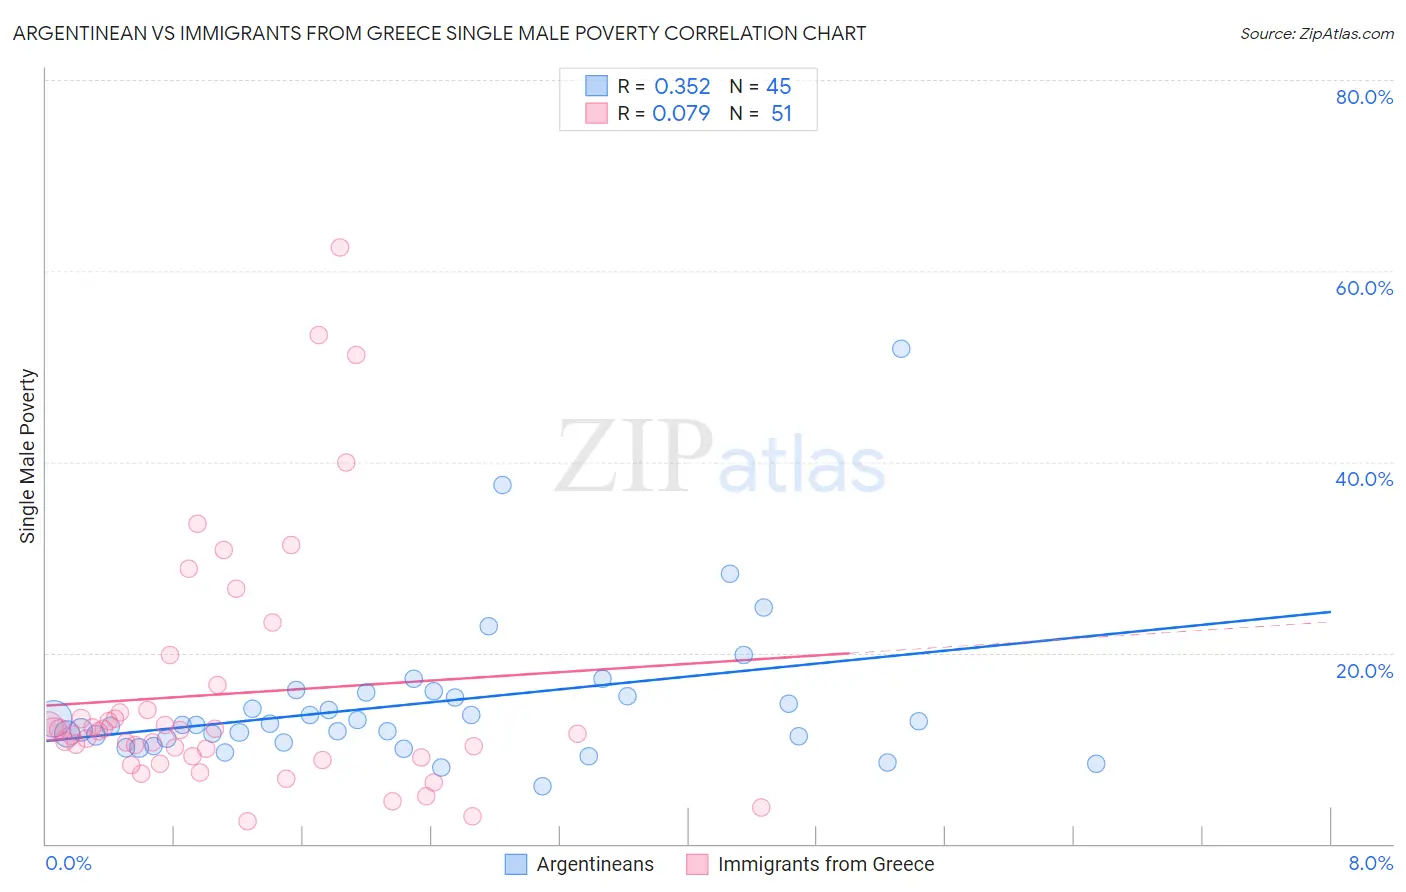
Argentinean vs Immigrants from Greece Single Male Poverty Correlation Chart

The statistical analysis conducted on geographies consisting of 268,813,546 people shows a mild positive correlation between the proportion of Argentineans and poverty level among single males in the United States with a correlation coefficient (R) of 0.352 and weighted average of 11.9%. Similarly, the statistical analysis conducted on geographies consisting of 196,065,310 people shows a slight positive correlation between the proportion of Immigrants from Greece and poverty level among single males in the United States with a correlation coefficient (R) of 0.079 and weighted average of 11.9%, a difference of 0.31%.
Argentinean vs Immigrants from Greece Single Male Poverty

Single Male Poverty Correlation Summary

MeasurementArgentineanImmigrants from Greece
Minimum6.0%2.4%
Maximum51.8%62.5%
Range45.8%60.1%
Mean14.7%15.7%
Median12.4%11.7%
Interquartile 25% (IQ1)10.8%9.1%
Interquartile 75% (IQ3)15.6%14.0%
Interquartile Range (IQR)4.8%4.9%
Standard Deviation (Sample)7.9%12.9%
Standard Deviation (Population)7.9%12.8%

Demographics Similar to Argentineans and Immigrants from Greece by Single Male Poverty

In terms of single male poverty, the demographic groups most similar to Argentineans are Chilean (11.9%, a difference of 0.060%), Immigrants from Argentina (11.9%, a difference of 0.13%), Uruguayan (11.9%, a difference of 0.25%), Immigrants from Northern Africa (11.9%, a difference of 0.27%), and Immigrants from Nepal (11.9%, a difference of 0.37%). Similarly, the demographic groups most similar to Immigrants from Greece are Immigrants from Nepal (11.9%, a difference of 0.060%), Immigrants from Russia (11.9%, a difference of 0.080%), Immigrants from Croatia (11.9%, a difference of 0.10%), Immigrants from Ukraine (11.9%, a difference of 0.12%), and Immigrants from Uruguay (11.9%, a difference of 0.13%).
DemographicsRating | RankSingle Male Poverty
Immigrants | Sri Lanka
99.7
/100
|
#62
Exceptional
11.8%
Immigrants | Belarus
99.7
/100
|
#63
Exceptional
11.8%
Immigrants | Eastern Europe
99.6
/100
|
#64
Exceptional
11.8%
Laotians
99.6
/100
|
#65
Exceptional
11.9%
Immigrants | Uruguay
99.6
/100
|
#66
Exceptional
11.9%
Immigrants | Ukraine
99.6
/100
|
#67
Exceptional
11.9%
Immigrants | Croatia
99.6
/100
|
#68
Exceptional
11.9%
Immigrants | Russia
99.6
/100
|
#69
Exceptional
11.9%
Immigrants | Nepal
99.6
/100
|
#70
Exceptional
11.9%
Immigrants | Greece
99.6
/100
|
#71
Exceptional
11.9%
Immigrants | Argentina
99.5
/100
|
#72
Exceptional
11.9%
Argentineans
99.5
/100
|
#73
Exceptional
11.9%
Chileans
99.5
/100
|
#74
Exceptional
11.9%
Uruguayans
99.4
/100
|
#75
Exceptional
11.9%
Immigrants | Northern Africa
99.4
/100
|
#76
Exceptional
11.9%
Immigrants | Malaysia
99.2
/100
|
#77
Exceptional
12.0%
Immigrants | Venezuela
99.1
/100
|
#78
Exceptional
12.0%
Immigrants | Belgium
99.0
/100
|
#79
Exceptional
12.0%
Armenians
98.7
/100
|
#80
Exceptional
12.1%
Immigrants | South America
98.7
/100
|
#81
Exceptional
12.1%
Immigrants | Colombia
98.6
/100
|
#82
Exceptional
12.1%