Arapaho vs Slovene Female Poverty Among 18-24 Year Olds
COMPARE
Arapaho
Slovene
Female Poverty Among 18-24 Year Olds
Female Poverty Among 18-24 Year Olds Comparison
Arapaho
Slovenes
25.2%
FEMALE POVERTY AMONG 18-24 YEAR OLDS
0.0/ 100
METRIC RATING
323rd/ 347
METRIC RANK
19.3%
FEMALE POVERTY AMONG 18-24 YEAR OLDS
96.2/ 100
METRIC RATING
114th/ 347
METRIC RANK
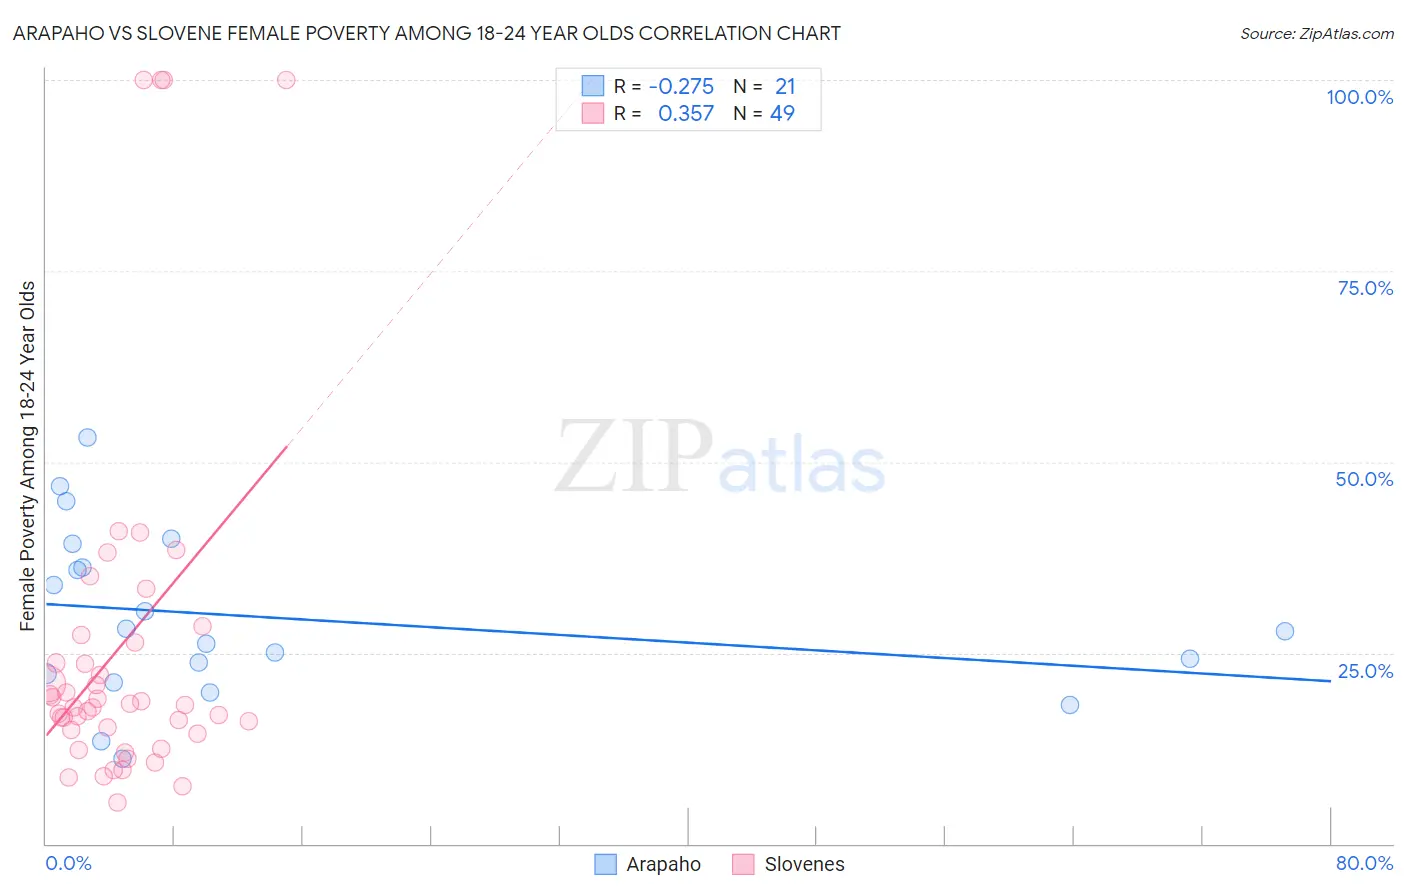
Arapaho vs Slovene Female Poverty Among 18-24 Year Olds Correlation Chart
The statistical analysis conducted on geographies consisting of 29,593,135 people shows a weak negative correlation between the proportion of Arapaho and poverty level among females between the ages 18 and 24 in the United States with a correlation coefficient (R) of -0.275 and weighted average of 25.2%. Similarly, the statistical analysis conducted on geographies consisting of 255,615,835 people shows a mild positive correlation between the proportion of Slovenes and poverty level among females between the ages 18 and 24 in the United States with a correlation coefficient (R) of 0.357 and weighted average of 19.3%, a difference of 30.4%.
Female Poverty Among 18-24 Year Olds Correlation Summary
| Measurement | Arapaho | Slovene |
| Minimum | 11.1% | 5.4% |
| Maximum | 53.1% | 100.0% |
| Range | 42.0% | 94.6% |
| Mean | 29.6% | 26.0% |
| Median | 27.8% | 18.2% |
| Interquartile 25% (IQ1) | 21.7% | 14.6% |
| Interquartile 75% (IQ3) | 37.7% | 26.8% |
| Interquartile Range (IQR) | 16.0% | 12.2% |
| Standard Deviation (Sample) | 11.0% | 23.9% |
| Standard Deviation (Population) | 10.8% | 23.6% |
Similar Demographics by Female Poverty Among 18-24 Year Olds
Demographics Similar to Arapaho by Female Poverty Among 18-24 Year Olds
In terms of female poverty among 18-24 year olds, the demographic groups most similar to Arapaho are German Russian (25.2%, a difference of 0.030%), Somali (25.1%, a difference of 0.070%), Immigrants from Zaire (25.1%, a difference of 0.37%), Immigrants from Saudi Arabia (25.3%, a difference of 0.46%), and Yakama (25.3%, a difference of 0.71%).
| Demographics | Rating | Rank | Female Poverty Among 18-24 Year Olds |
| Alsatians | 0.0 /100 | #316 | Tragic 24.4% |
| Osage | 0.0 /100 | #317 | Tragic 24.5% |
| Chickasaw | 0.0 /100 | #318 | Tragic 24.5% |
| Dutch West Indians | 0.0 /100 | #319 | Tragic 24.5% |
| Immigrants | Congo | 0.0 /100 | #320 | Tragic 24.6% |
| Immigrants | Zaire | 0.0 /100 | #321 | Tragic 25.1% |
| Somalis | 0.0 /100 | #322 | Tragic 25.1% |
| Arapaho | 0.0 /100 | #323 | Tragic 25.2% |
| German Russians | 0.0 /100 | #324 | Tragic 25.2% |
| Immigrants | Saudi Arabia | 0.0 /100 | #325 | Tragic 25.3% |
| Yakama | 0.0 /100 | #326 | Tragic 25.3% |
| Ute | 0.0 /100 | #327 | Tragic 25.4% |
| Natives/Alaskans | 0.0 /100 | #328 | Tragic 25.4% |
| Cajuns | 0.0 /100 | #329 | Tragic 25.7% |
| Immigrants | Somalia | 0.0 /100 | #330 | Tragic 25.7% |
Demographics Similar to Slovenes by Female Poverty Among 18-24 Year Olds
In terms of female poverty among 18-24 year olds, the demographic groups most similar to Slovenes are Immigrants from Hungary (19.3%, a difference of 0.010%), Immigrants from Cameroon (19.3%, a difference of 0.040%), Immigrants from El Salvador (19.3%, a difference of 0.10%), Immigrants (19.3%, a difference of 0.11%), and Immigrants from Iran (19.3%, a difference of 0.15%).
| Demographics | Rating | Rank | Female Poverty Among 18-24 Year Olds |
| Immigrants | Sri Lanka | 97.5 /100 | #107 | Exceptional 19.2% |
| Immigrants | Uzbekistan | 97.3 /100 | #108 | Exceptional 19.2% |
| Immigrants | Syria | 97.2 /100 | #109 | Exceptional 19.2% |
| Laotians | 97.1 /100 | #110 | Exceptional 19.2% |
| Immigrants | Serbia | 97.1 /100 | #111 | Exceptional 19.2% |
| Immigrants | El Salvador | 96.5 /100 | #112 | Exceptional 19.3% |
| Immigrants | Cameroon | 96.3 /100 | #113 | Exceptional 19.3% |
| Slovenes | 96.2 /100 | #114 | Exceptional 19.3% |
| Immigrants | Hungary | 96.2 /100 | #115 | Exceptional 19.3% |
| Immigrants | Immigrants | 95.9 /100 | #116 | Exceptional 19.3% |
| Immigrants | Iran | 95.8 /100 | #117 | Exceptional 19.3% |
| Immigrants | Guyana | 95.6 /100 | #118 | Exceptional 19.3% |
| Cypriots | 95.5 /100 | #119 | Exceptional 19.3% |
| Immigrants | Northern Europe | 95.4 /100 | #120 | Exceptional 19.4% |
| Guyanese | 95.3 /100 | #121 | Exceptional 19.4% |