Arapaho vs Pennsylvania German Child Poverty Under the Age of 5

COMPARE

Arapaho
Race
Ancestry
AfghanAfricanAlaska NativeAlaskan AthabascanAlbanianAleutAlsatianAmericanApacheArabArapahoArgentineanArmenianAssyrian/Chaldean/SyriacAustralianAustrianBahamianBangladeshiBarbadianBasqueBelgianBelizeanBermudanBhutaneseBlackfeetBolivianBrazilianBritishBritish West IndianBulgarianBurmeseCajunCambodianCanadianCape VerdeanCarpatho RusynCelticCentral AmericanCentral American IndianCherokeeCheyenneChickasawChileanChineseChippewaChoctawColombianColvilleComancheCosta RicanCreeCreekCroatianCrowCubanCypriotCzechCzechoslovakianDanishDelawareDominicanDutchDutch West IndianEastern EuropeanEcuadorianEgyptianEnglishEstonianEthiopianEuropeanFijianFilipinoFinnishFrenchFrench American IndianFrench CanadianGermanGerman RussianGhanaianGreekGuamanian/ChamorroGuatemalanGuyaneseHaitianHmongHonduranHopiHoumaHungarianIcelanderIndian (Asian)IndonesianInupiatIranianIraqiIrishIroquoisIsraeliItalianJamaicanJapaneseJordanianKenyanKiowaKoreanLaotianLatvianLebaneseLiberianLithuanianLumbeeLuxembourgerMacedonianMalaysianMalteseMarshalleseMenomineeMexicanMexican American IndianMongolianMoroccanNative HawaiianNavajoNepaleseNew ZealanderNicaraguanNigerianNorthern EuropeanNorwegianOkinawanOsageOttawaPaiutePakistaniPalestinianPanamanianParaguayanPeruvianPimaPolishPortuguesePotawatomiPuebloPuerto RicanPuget Sound SalishRomanianRussianSalvadoranSamoanScandinavianScotch-IrishScottishSeminoleSenegaleseSerbianShoshoneSierra LeoneanSiouxSlavicSlovakSloveneSomaliSouth AfricanSouth AmericanSouth American IndianSoviet UnionSpaniardSpanishSpanish AmericanSpanish American IndianSri LankanSubsaharan AfricanSudaneseSwedishSwissSyrianTaiwaneseThaiTlingit-HaidaTohono O'OdhamTonganTrinidadian and TobagonianTsimshianTurkishU.S. Virgin IslanderUgandanUkrainianUruguayanUteVenezuelanVietnameseWelshWest IndianYakamaYaquiYugoslavianYumanYup'ikZimbabwean
Immigration
NonimmigrantsImmigrantsAfghanistanAfricaAlbaniaArgentinaArmeniaAsiaAustraliaAustriaBahamasBangladeshBarbadosBelarusBelgiumBelizeBoliviaBosnia and HerzegovinaBrazilBulgariaBurma/MyanmarCabo VerdeCambodiaCameroonCanadaCaribbeanCentral AmericaChileChinaColombiaCongoCosta RicaCroatiaCubaCzechoslovakiaDenmarkDominicaDominican RepublicEastern AfricaEastern AsiaEastern EuropeEcuadorEgyptEl SalvadorEnglandEritreaEthiopiaEuropeFijiFranceGermanyGhanaGreeceGrenadaGuatemalaGuyanaHaitiHondurasHong KongHungaryIndiaIndonesiaIranIraqIrelandIsraelItalyJamaicaJapanJordanKazakhstanKenyaKoreaKuwaitLaosLatin AmericaLatviaLebanonLiberiaLithuaniaMalaysiaMexicoMicronesiaMiddle AfricaMoldovaMoroccoNepalNetherlandsNicaraguaNigeriaNorth AmericaNorth MacedoniaNorthern AfricaNorthern EuropeNorwayOceaniaPakistanPanamaPeruPhilippinesPolandPortugalRomaniaRussiaSaudi ArabiaScotlandSenegalSerbiaSierra LeoneSingaporeSomaliaSouth AfricaSouth AmericaSouth Central AsiaSouth Eastern AsiaSouthern EuropeSpainSri LankaSt. Vincent and the GrenadinesSudanSwedenSwitzerlandSyriaTaiwanThailandTrinidad and TobagoTurkeyUgandaUkraineUruguayUzbekistanVenezuelaVietnamWest IndiesWestern AfricaWestern AsiaWestern EuropeYemenZaireZimbabweAzores
Pennsylvania German
Race
Ancestry
AfghanAfricanAlaska NativeAlaskan AthabascanAlbanianAleutAlsatianAmericanApacheArabArgentineanArmenianAssyrian/Chaldean/SyriacAustralianAustrianBahamianBangladeshiBarbadianBasqueBelgianBelizeanBermudanBhutaneseBlackfeetBolivianBrazilianBritishBritish West IndianBulgarianBurmeseCajunCambodianCanadianCape VerdeanCarpatho RusynCelticCentral AmericanCentral American IndianCherokeeCheyenneChickasawChileanChineseChippewaChoctawColombianColvilleComancheCosta RicanCreeCreekCroatianCrowCubanCypriotCzechCzechoslovakianDanishDelawareDominicanDutchDutch West IndianEastern EuropeanEcuadorianEgyptianEnglishEstonianEthiopianEuropeanFijianFilipinoFinnishFrenchFrench American IndianFrench CanadianGermanGerman RussianGhanaianGreekGuamanian/ChamorroGuatemalanGuyaneseHaitianHmongHonduranHopiHoumaHungarianIcelanderIndian (Asian)IndonesianInupiatIranianIraqiIrishIroquoisIsraeliItalianJamaicanJapaneseJordanianKenyanKiowaKoreanLaotianLatvianLebaneseLiberianLithuanianLumbeeLuxembourgerMacedonianMalaysianMalteseMarshalleseMenomineeMexicanMexican American IndianMongolianMoroccanNative HawaiianNavajoNepaleseNew ZealanderNicaraguanNigerianNorthern EuropeanNorwegianOkinawanOsageOttawaPaiutePakistaniPalestinianPanamanianParaguayanPennsylvania GermanPeruvianPimaPolishPortuguesePotawatomiPuebloPuerto RicanPuget Sound SalishRomanianRussianSalvadoranSamoanScandinavianScotch-IrishScottishSeminoleSenegaleseSerbianShoshoneSierra LeoneanSiouxSlavicSlovakSloveneSomaliSouth AfricanSouth AmericanSouth American IndianSoviet UnionSpaniardSpanishSpanish AmericanSpanish American IndianSri LankanSubsaharan AfricanSudaneseSwedishSwissSyrianTaiwaneseThaiTlingit-HaidaTohono O'OdhamTonganTrinidadian and TobagonianTsimshianTurkishU.S. Virgin IslanderUgandanUkrainianUruguayanUteVenezuelanVietnameseWelshWest IndianYakamaYaquiYugoslavianYumanYup'ikZimbabwean
Immigration
NonimmigrantsImmigrantsAfghanistanAfricaAlbaniaArgentinaArmeniaAsiaAustraliaAustriaBahamasBangladeshBarbadosBelarusBelgiumBelizeBoliviaBosnia and HerzegovinaBrazilBulgariaBurma/MyanmarCabo VerdeCambodiaCameroonCanadaCaribbeanCentral AmericaChileChinaColombiaCongoCosta RicaCroatiaCubaCzechoslovakiaDenmarkDominicaDominican RepublicEastern AfricaEastern AsiaEastern EuropeEcuadorEgyptEl SalvadorEnglandEritreaEthiopiaEuropeFijiFranceGermanyGhanaGreeceGrenadaGuatemalaGuyanaHaitiHondurasHong KongHungaryIndiaIndonesiaIranIraqIrelandIsraelItalyJamaicaJapanJordanKazakhstanKenyaKoreaKuwaitLaosLatin AmericaLatviaLebanonLiberiaLithuaniaMalaysiaMexicoMicronesiaMiddle AfricaMoldovaMoroccoNepalNetherlandsNicaraguaNigeriaNorth AmericaNorth MacedoniaNorthern AfricaNorthern EuropeNorwayOceaniaPakistanPanamaPeruPhilippinesPolandPortugalRomaniaRussiaSaudi ArabiaScotlandSenegalSerbiaSierra LeoneSingaporeSomaliaSouth AfricaSouth AmericaSouth Central AsiaSouth Eastern AsiaSouthern EuropeSpainSri LankaSt. Vincent and the GrenadinesSudanSwedenSwitzerlandSyriaTaiwanThailandTrinidad and TobagoTurkeyUgandaUkraineUruguayUzbekistanVenezuelaVietnamWest IndiesWestern AfricaWestern AsiaWestern EuropeYemenZaireZimbabweAzores
Child Poverty Under the Age of 5
Income
Poverty
Unemployment
Labor Participation
Family Structure
Vehicle Availability
Education Level
Disability

Child Poverty Under the Age of 5 Comparison

Arapaho

Pennsylvania Germans

Tragic
Tragic
23.1%
CHILD POVERTY UNDER THE AGE OF 5
0.0/ 100
METRIC RATING
315th/ 347
METRIC RANK
19.8%
CHILD POVERTY UNDER THE AGE OF 5
0.3/ 100
METRIC RATING
251st/ 347
METRIC RANK

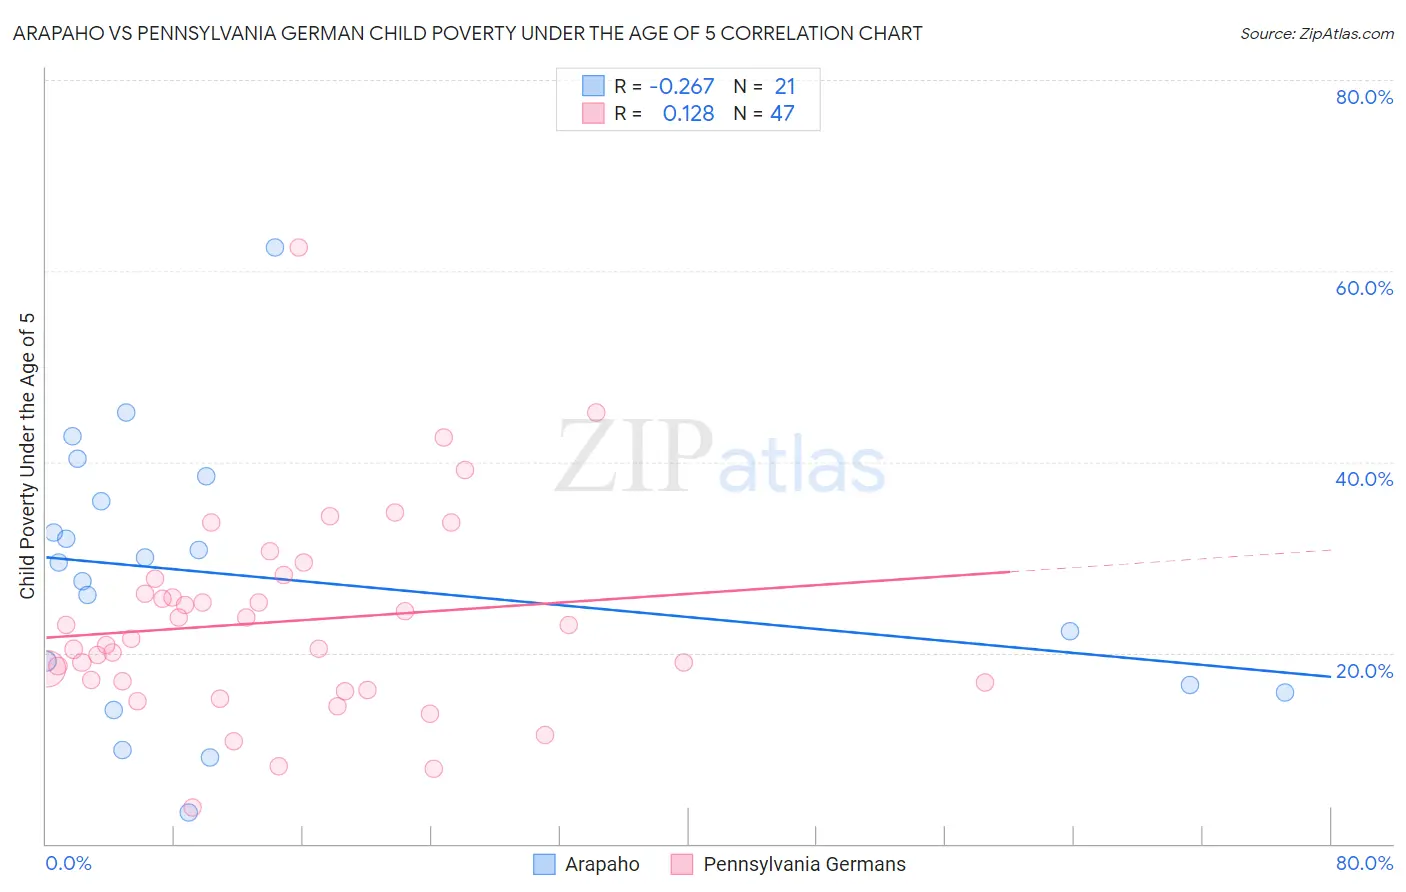
Arapaho vs Pennsylvania German Child Poverty Under the Age of 5 Correlation Chart

The statistical analysis conducted on geographies consisting of 29,632,672 people shows a weak negative correlation between the proportion of Arapaho and poverty level among children under the age of 5 in the United States with a correlation coefficient (R) of -0.267 and weighted average of 23.1%. Similarly, the statistical analysis conducted on geographies consisting of 226,788,326 people shows a poor positive correlation between the proportion of Pennsylvania Germans and poverty level among children under the age of 5 in the United States with a correlation coefficient (R) of 0.128 and weighted average of 19.8%, a difference of 16.9%.
Arapaho vs Pennsylvania German Child Poverty Under the Age of 5

Child Poverty Under the Age of 5 Correlation Summary

MeasurementArapahoPennsylvania German
Minimum3.3%3.8%
Maximum62.5%62.5%
Range59.2%58.7%
Mean27.8%23.3%
Median29.5%21.4%
Interquartile 25% (IQ1)16.3%16.9%
Interquartile 75% (IQ3)37.2%27.8%
Interquartile Range (IQR)20.9%10.9%
Standard Deviation (Sample)14.1%10.5%
Standard Deviation (Population)13.7%10.4%

Similar Demographics by Child Poverty Under the Age of 5

Demographics Similar to Arapaho by Child Poverty Under the Age of 5

In terms of child poverty under the age of 5, the demographic groups most similar to Arapaho are Yakama (23.1%, a difference of 0.12%), U.S. Virgin Islander (23.0%, a difference of 0.56%), Menominee (23.3%, a difference of 0.62%), Bahamian (23.0%, a difference of 0.65%), and Honduran (23.0%, a difference of 0.70%).
DemographicsRating | RankChild Poverty Under the Age of 5
Immigrants | Dominica
0.0
/100
|
#308
Tragic
22.7%
Houma
0.0
/100
|
#309
Tragic
22.7%
Africans
0.0
/100
|
#310
Tragic
22.8%
Seminole
0.0
/100
|
#311
Tragic
22.8%
Hondurans
0.0
/100
|
#312
Tragic
23.0%
Bahamians
0.0
/100
|
#313
Tragic
23.0%
U.S. Virgin Islanders
0.0
/100
|
#314
Tragic
23.0%
Arapaho
0.0
/100
|
#315
Tragic
23.1%
Yakama
0.0
/100
|
#316
Tragic
23.1%
Menominee
0.0
/100
|
#317
Tragic
23.3%
Dutch West Indians
0.0
/100
|
#318
Tragic
23.3%
Chippewa
0.0
/100
|
#319
Tragic
23.4%
Choctaw
0.0
/100
|
#320
Tragic
23.5%
Immigrants | Honduras
0.0
/100
|
#321
Tragic
23.5%
Ute
0.0
/100
|
#322
Tragic
23.5%

Demographics Similar to Pennsylvania Germans by Child Poverty Under the Age of 5

In terms of child poverty under the age of 5, the demographic groups most similar to Pennsylvania Germans are Immigrants from Nicaragua (19.8%, a difference of 0.040%), Nonimmigrants (19.7%, a difference of 0.17%), Immigrants from Middle Africa (19.7%, a difference of 0.22%), Marshallese (19.7%, a difference of 0.24%), and Guyanese (19.7%, a difference of 0.26%).
DemographicsRating | RankChild Poverty Under the Age of 5
Immigrants | Ghana
0.5
/100
|
#244
Tragic
19.6%
Immigrants | Western Africa
0.4
/100
|
#245
Tragic
19.7%
Cree
0.4
/100
|
#246
Tragic
19.7%
Guyanese
0.4
/100
|
#247
Tragic
19.7%
Marshallese
0.4
/100
|
#248
Tragic
19.7%
Immigrants | Middle Africa
0.4
/100
|
#249
Tragic
19.7%
Immigrants | Nonimmigrants
0.4
/100
|
#250
Tragic
19.7%
Pennsylvania Germans
0.3
/100
|
#251
Tragic
19.8%
Immigrants | Nicaragua
0.3
/100
|
#252
Tragic
19.8%
Mexican American Indians
0.3
/100
|
#253
Tragic
19.9%
Fijians
0.3
/100
|
#254
Tragic
19.9%
Immigrants | Cuba
0.2
/100
|
#255
Tragic
19.9%
Immigrants | Barbados
0.2
/100
|
#256
Tragic
20.0%
Shoshone
0.2
/100
|
#257
Tragic
20.0%
Immigrants | St. Vincent and the Grenadines
0.2
/100
|
#258
Tragic
20.0%