Arapaho vs Irish Seniors Poverty Over the Age of 75

COMPARE

Arapaho
Race
Ancestry
AfghanAfricanAlaska NativeAlaskan AthabascanAlbanianAleutAlsatianAmericanApacheArabArapahoArgentineanArmenianAssyrian/Chaldean/SyriacAustralianAustrianBahamianBangladeshiBarbadianBasqueBelgianBelizeanBermudanBhutaneseBlackfeetBolivianBrazilianBritishBritish West IndianBulgarianBurmeseCajunCambodianCanadianCape VerdeanCarpatho RusynCelticCentral AmericanCentral American IndianCherokeeCheyenneChickasawChileanChineseChippewaChoctawColombianColvilleComancheCosta RicanCreeCreekCroatianCrowCubanCypriotCzechCzechoslovakianDanishDelawareDominicanDutchDutch West IndianEastern EuropeanEcuadorianEgyptianEnglishEstonianEthiopianEuropeanFijianFilipinoFinnishFrenchFrench American IndianFrench CanadianGermanGerman RussianGhanaianGreekGuamanian/ChamorroGuatemalanGuyaneseHaitianHmongHonduranHopiHoumaHungarianIcelanderIndian (Asian)IndonesianInupiatIranianIraqiIroquoisIsraeliItalianJamaicanJapaneseJordanianKenyanKiowaKoreanLaotianLatvianLebaneseLiberianLithuanianLumbeeLuxembourgerMacedonianMalaysianMalteseMarshalleseMenomineeMexicanMexican American IndianMongolianMoroccanNative HawaiianNavajoNepaleseNew ZealanderNicaraguanNigerianNorthern EuropeanNorwegianOkinawanOsageOttawaPaiutePakistaniPalestinianPanamanianParaguayanPennsylvania GermanPeruvianPimaPolishPortuguesePotawatomiPuebloPuerto RicanPuget Sound SalishRomanianRussianSalvadoranSamoanScandinavianScotch-IrishScottishSeminoleSenegaleseSerbianShoshoneSierra LeoneanSiouxSlavicSlovakSloveneSomaliSouth AfricanSouth AmericanSouth American IndianSoviet UnionSpaniardSpanishSpanish AmericanSpanish American IndianSri LankanSubsaharan AfricanSudaneseSwedishSwissSyrianTaiwaneseThaiTlingit-HaidaTohono O'OdhamTonganTrinidadian and TobagonianTsimshianTurkishU.S. Virgin IslanderUgandanUkrainianUruguayanUteVenezuelanVietnameseWelshWest IndianYakamaYaquiYugoslavianYumanYup'ikZimbabwean
Immigration
NonimmigrantsImmigrantsAfghanistanAfricaAlbaniaArgentinaArmeniaAsiaAustraliaAustriaBahamasBangladeshBarbadosBelarusBelgiumBelizeBoliviaBosnia and HerzegovinaBrazilBulgariaBurma/MyanmarCabo VerdeCambodiaCameroonCanadaCaribbeanCentral AmericaChileChinaColombiaCongoCosta RicaCroatiaCubaCzechoslovakiaDenmarkDominicaDominican RepublicEastern AfricaEastern AsiaEastern EuropeEcuadorEgyptEl SalvadorEnglandEritreaEthiopiaEuropeFijiFranceGermanyGhanaGreeceGrenadaGuatemalaGuyanaHaitiHondurasHong KongHungaryIndiaIndonesiaIranIraqIrelandIsraelItalyJamaicaJapanJordanKazakhstanKenyaKoreaKuwaitLaosLatin AmericaLatviaLebanonLiberiaLithuaniaMalaysiaMexicoMicronesiaMiddle AfricaMoldovaMoroccoNepalNetherlandsNicaraguaNigeriaNorth AmericaNorth MacedoniaNorthern AfricaNorthern EuropeNorwayOceaniaPakistanPanamaPeruPhilippinesPolandPortugalRomaniaRussiaSaudi ArabiaScotlandSenegalSerbiaSierra LeoneSingaporeSomaliaSouth AfricaSouth AmericaSouth Central AsiaSouth Eastern AsiaSouthern EuropeSpainSri LankaSt. Vincent and the GrenadinesSudanSwedenSwitzerlandSyriaTaiwanThailandTrinidad and TobagoTurkeyUgandaUkraineUruguayUzbekistanVenezuelaVietnamWest IndiesWestern AfricaWestern AsiaWestern EuropeYemenZaireZimbabweAzores
Irish
Race
Ancestry
AfghanAfricanAlaska NativeAlaskan AthabascanAlbanianAleutAlsatianAmericanApacheArabArgentineanArmenianAssyrian/Chaldean/SyriacAustralianAustrianBahamianBangladeshiBarbadianBasqueBelgianBelizeanBermudanBhutaneseBlackfeetBolivianBrazilianBritishBritish West IndianBulgarianBurmeseCajunCambodianCanadianCape VerdeanCarpatho RusynCelticCentral AmericanCentral American IndianCherokeeCheyenneChickasawChileanChineseChippewaChoctawColombianColvilleComancheCosta RicanCreeCreekCroatianCrowCubanCypriotCzechCzechoslovakianDanishDelawareDominicanDutchDutch West IndianEastern EuropeanEcuadorianEgyptianEnglishEstonianEthiopianEuropeanFijianFilipinoFinnishFrenchFrench American IndianFrench CanadianGermanGerman RussianGhanaianGreekGuamanian/ChamorroGuatemalanGuyaneseHaitianHmongHonduranHopiHoumaHungarianIcelanderIndian (Asian)IndonesianInupiatIranianIraqiIrishIroquoisIsraeliItalianJamaicanJapaneseJordanianKenyanKiowaKoreanLaotianLatvianLebaneseLiberianLithuanianLumbeeLuxembourgerMacedonianMalaysianMalteseMarshalleseMenomineeMexicanMexican American IndianMongolianMoroccanNative HawaiianNavajoNepaleseNew ZealanderNicaraguanNigerianNorthern EuropeanNorwegianOkinawanOsageOttawaPaiutePakistaniPalestinianPanamanianParaguayanPennsylvania GermanPeruvianPimaPolishPortuguesePotawatomiPuebloPuerto RicanPuget Sound SalishRomanianRussianSalvadoranSamoanScandinavianScotch-IrishScottishSeminoleSenegaleseSerbianShoshoneSierra LeoneanSiouxSlavicSlovakSloveneSomaliSouth AfricanSouth AmericanSouth American IndianSoviet UnionSpaniardSpanishSpanish AmericanSpanish American IndianSri LankanSubsaharan AfricanSudaneseSwedishSwissSyrianTaiwaneseThaiTlingit-HaidaTohono O'OdhamTonganTrinidadian and TobagonianTsimshianTurkishU.S. Virgin IslanderUgandanUkrainianUruguayanUteVenezuelanVietnameseWelshWest IndianYakamaYaquiYugoslavianYumanYup'ikZimbabwean
Immigration
NonimmigrantsImmigrantsAfghanistanAfricaAlbaniaArgentinaArmeniaAsiaAustraliaAustriaBahamasBangladeshBarbadosBelarusBelgiumBelizeBoliviaBosnia and HerzegovinaBrazilBulgariaBurma/MyanmarCabo VerdeCambodiaCameroonCanadaCaribbeanCentral AmericaChileChinaColombiaCongoCosta RicaCroatiaCubaCzechoslovakiaDenmarkDominicaDominican RepublicEastern AfricaEastern AsiaEastern EuropeEcuadorEgyptEl SalvadorEnglandEritreaEthiopiaEuropeFijiFranceGermanyGhanaGreeceGrenadaGuatemalaGuyanaHaitiHondurasHong KongHungaryIndiaIndonesiaIranIraqIrelandIsraelItalyJamaicaJapanJordanKazakhstanKenyaKoreaKuwaitLaosLatin AmericaLatviaLebanonLiberiaLithuaniaMalaysiaMexicoMicronesiaMiddle AfricaMoldovaMoroccoNepalNetherlandsNicaraguaNigeriaNorth AmericaNorth MacedoniaNorthern AfricaNorthern EuropeNorwayOceaniaPakistanPanamaPeruPhilippinesPolandPortugalRomaniaRussiaSaudi ArabiaScotlandSenegalSerbiaSierra LeoneSingaporeSomaliaSouth AfricaSouth AmericaSouth Central AsiaSouth Eastern AsiaSouthern EuropeSpainSri LankaSt. Vincent and the GrenadinesSudanSwedenSwitzerlandSyriaTaiwanThailandTrinidad and TobagoTurkeyUgandaUkraineUruguayUzbekistanVenezuelaVietnamWest IndiesWestern AfricaWestern AsiaWestern EuropeYemenZaireZimbabweAzores
Seniors Poverty Over the Age of 75
Income
Poverty
Unemployment
Labor Participation
Family Structure
Vehicle Availability
Education Level
Disability

Seniors Poverty Over the Age of 75 Comparison

Arapaho

Irish

Poor
Exceptional
12.7%
SENIORS POVERTY OVER THE AGE OF 75
10.9/ 100
METRIC RATING
202nd/ 347
METRIC RANK
10.7%
SENIORS POVERTY OVER THE AGE OF 75
99.8/ 100
METRIC RATING
28th/ 347
METRIC RANK

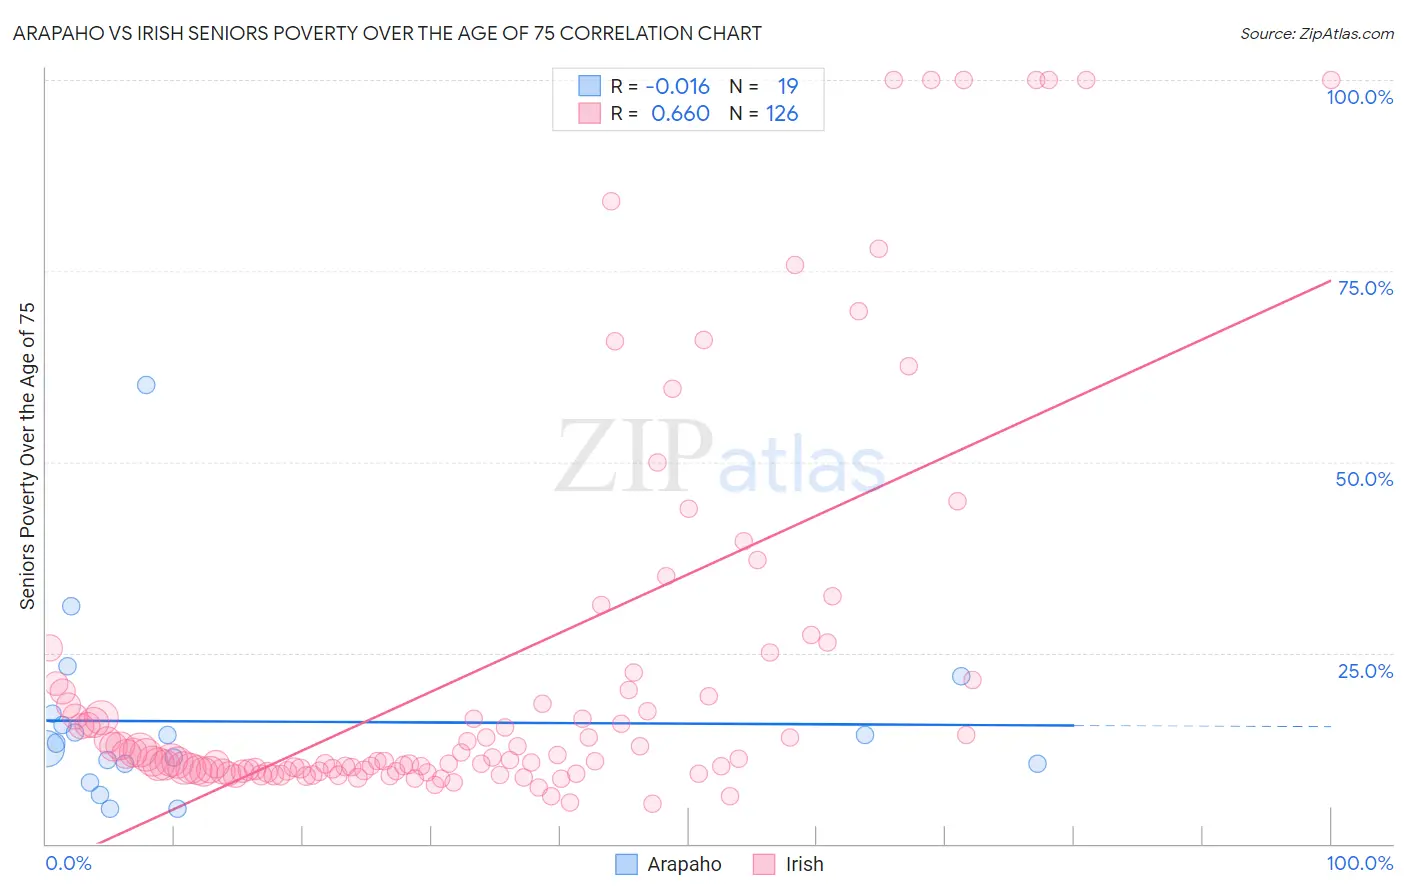
Arapaho vs Irish Seniors Poverty Over the Age of 75 Correlation Chart

The statistical analysis conducted on geographies consisting of 29,654,575 people shows no correlation between the proportion of Arapaho and poverty level among seniors over the age of 75 in the United States with a correlation coefficient (R) of -0.016 and weighted average of 12.7%. Similarly, the statistical analysis conducted on geographies consisting of 560,822,051 people shows a significant positive correlation between the proportion of Irish and poverty level among seniors over the age of 75 in the United States with a correlation coefficient (R) of 0.660 and weighted average of 10.7%, a difference of 18.9%.
Arapaho vs Irish Seniors Poverty Over the Age of 75

Seniors Poverty Over the Age of 75 Correlation Summary

MeasurementArapahoIrish
Minimum4.5%5.2%
Maximum60.0%100.0%
Range55.5%94.8%
Mean16.0%22.4%
Median13.2%11.1%
Interquartile 25% (IQ1)10.5%9.5%
Interquartile 75% (IQ3)17.1%19.9%
Interquartile Range (IQR)6.6%10.4%
Standard Deviation (Sample)12.5%24.7%
Standard Deviation (Population)12.2%24.6%

Similar Demographics by Seniors Poverty Over the Age of 75

Demographics Similar to Arapaho by Seniors Poverty Over the Age of 75

In terms of seniors poverty over the age of 75, the demographic groups most similar to Arapaho are Paraguayan (12.7%, a difference of 0.030%), Immigrants from Southern Europe (12.7%, a difference of 0.060%), Immigrants from Eritrea (12.7%, a difference of 0.090%), Immigrants from Vietnam (12.7%, a difference of 0.23%), and Indian (Asian) (12.7%, a difference of 0.25%).
DemographicsRating | RankSeniors Poverty Over the Age of 75
Immigrants | France
17.4
/100
|
#195
Poor
12.6%
Immigrants | Eastern Europe
16.0
/100
|
#196
Poor
12.6%
Nepalese
14.4
/100
|
#197
Poor
12.6%
Chileans
13.7
/100
|
#198
Poor
12.6%
Immigrants | Lebanon
12.7
/100
|
#199
Poor
12.7%
Immigrants | Vietnam
12.1
/100
|
#200
Poor
12.7%
Paraguayans
11.1
/100
|
#201
Poor
12.7%
Arapaho
10.9
/100
|
#202
Poor
12.7%
Immigrants | Southern Europe
10.7
/100
|
#203
Poor
12.7%
Immigrants | Eritrea
10.5
/100
|
#204
Poor
12.7%
Indians (Asian)
9.7
/100
|
#205
Tragic
12.7%
Albanians
9.6
/100
|
#206
Tragic
12.7%
Costa Ricans
8.7
/100
|
#207
Tragic
12.8%
Immigrants | Eastern Asia
8.4
/100
|
#208
Tragic
12.8%
Immigrants | Liberia
7.3
/100
|
#209
Tragic
12.8%

Demographics Similar to Irish by Seniors Poverty Over the Age of 75

In terms of seniors poverty over the age of 75, the demographic groups most similar to Irish are Northern European (10.7%, a difference of 0.060%), Assyrian/Chaldean/Syriac (10.7%, a difference of 0.15%), Swiss (10.7%, a difference of 0.23%), Bulgarian (10.7%, a difference of 0.33%), and Marshallese (10.7%, a difference of 0.41%).
DemographicsRating | RankSeniors Poverty Over the Age of 75
Slovenes
99.9
/100
|
#21
Exceptional
10.6%
Bhutanese
99.8
/100
|
#22
Exceptional
10.6%
Lithuanians
99.8
/100
|
#23
Exceptional
10.6%
Poles
99.8
/100
|
#24
Exceptional
10.6%
Menominee
99.8
/100
|
#25
Exceptional
10.6%
Bulgarians
99.8
/100
|
#26
Exceptional
10.7%
Northern Europeans
99.8
/100
|
#27
Exceptional
10.7%
Irish
99.8
/100
|
#28
Exceptional
10.7%
Assyrians/Chaldeans/Syriacs
99.8
/100
|
#29
Exceptional
10.7%
Swiss
99.7
/100
|
#30
Exceptional
10.7%
Marshallese
99.7
/100
|
#31
Exceptional
10.7%
British
99.7
/100
|
#32
Exceptional
10.7%
Puget Sound Salish
99.7
/100
|
#33
Exceptional
10.8%
Italians
99.7
/100
|
#34
Exceptional
10.8%
Luxembourgers
99.6
/100
|
#35
Exceptional
10.8%