Arab vs Immigrants from Jordan Seniors Poverty Over the Age of 65
COMPARE
Arab
Immigrants from Jordan
Seniors Poverty Over the Age of 65
Seniors Poverty Over the Age of 65 Comparison
Arabs
Immigrants from Jordan
10.8%
SENIORS POVERTY OVER THE AGE OF 65
65.2/ 100
METRIC RATING
161st/ 347
METRIC RANK
10.2%
SENIORS POVERTY OVER THE AGE OF 65
94.7/ 100
METRIC RATING
101st/ 347
METRIC RANK
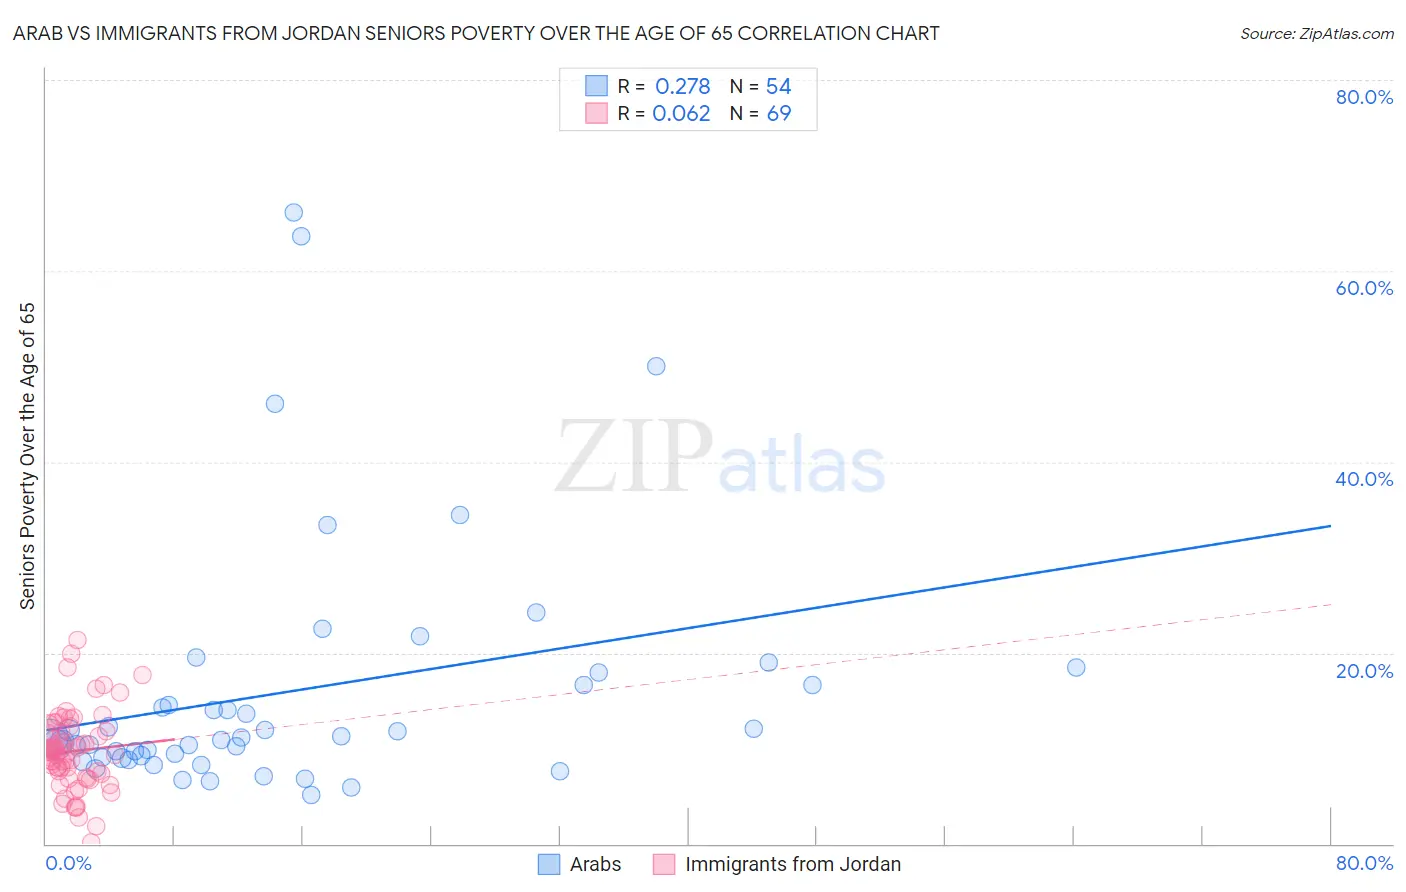
Arab vs Immigrants from Jordan Seniors Poverty Over the Age of 65 Correlation Chart
The statistical analysis conducted on geographies consisting of 484,434,230 people shows a weak positive correlation between the proportion of Arabs and poverty level among seniors over the age of 65 in the United States with a correlation coefficient (R) of 0.278 and weighted average of 10.8%. Similarly, the statistical analysis conducted on geographies consisting of 181,113,233 people shows a slight positive correlation between the proportion of Immigrants from Jordan and poverty level among seniors over the age of 65 in the United States with a correlation coefficient (R) of 0.062 and weighted average of 10.2%, a difference of 5.3%.
Seniors Poverty Over the Age of 65 Correlation Summary
| Measurement | Arab | Immigrants from Jordan |
| Minimum | 5.0% | 0.093% |
| Maximum | 66.1% | 21.3% |
| Range | 61.1% | 21.2% |
| Mean | 15.9% | 9.7% |
| Median | 11.1% | 9.7% |
| Interquartile 25% (IQ1) | 9.1% | 7.1% |
| Interquartile 75% (IQ3) | 16.7% | 12.0% |
| Interquartile Range (IQR) | 7.6% | 4.9% |
| Standard Deviation (Sample) | 13.2% | 4.1% |
| Standard Deviation (Population) | 13.1% | 4.1% |
Similar Demographics by Seniors Poverty Over the Age of 65
Demographics Similar to Arabs by Seniors Poverty Over the Age of 65
In terms of seniors poverty over the age of 65, the demographic groups most similar to Arabs are Immigrants from Indonesia (10.8%, a difference of 0.040%), Tsimshian (10.8%, a difference of 0.070%), Potawatomi (10.8%, a difference of 0.26%), Sudanese (10.7%, a difference of 0.31%), and Immigrants from South Eastern Asia (10.8%, a difference of 0.31%).
| Demographics | Rating | Rank | Seniors Poverty Over the Age of 65 |
| Immigrants | Saudi Arabia | 74.9 /100 | #154 | Good 10.7% |
| Chickasaw | 73.6 /100 | #155 | Good 10.7% |
| Ethiopians | 72.9 /100 | #156 | Good 10.7% |
| Immigrants | Ethiopia | 72.9 /100 | #157 | Good 10.7% |
| Immigrants | Sierra Leone | 71.7 /100 | #158 | Good 10.7% |
| Immigrants | Micronesia | 70.8 /100 | #159 | Good 10.7% |
| Sudanese | 68.2 /100 | #160 | Good 10.7% |
| Arabs | 65.2 /100 | #161 | Good 10.8% |
| Immigrants | Indonesia | 64.8 /100 | #162 | Good 10.8% |
| Tsimshian | 64.5 /100 | #163 | Good 10.8% |
| Potawatomi | 62.6 /100 | #164 | Good 10.8% |
| Immigrants | South Eastern Asia | 62.1 /100 | #165 | Good 10.8% |
| Malaysians | 62.0 /100 | #166 | Good 10.8% |
| Alaska Natives | 60.3 /100 | #167 | Good 10.8% |
| Mongolians | 58.0 /100 | #168 | Average 10.9% |
Demographics Similar to Immigrants from Jordan by Seniors Poverty Over the Age of 65
In terms of seniors poverty over the age of 65, the demographic groups most similar to Immigrants from Jordan are Delaware (10.2%, a difference of 0.10%), Icelander (10.3%, a difference of 0.15%), South African (10.3%, a difference of 0.19%), Aleut (10.3%, a difference of 0.26%), and Kenyan (10.3%, a difference of 0.28%).
| Demographics | Rating | Rank | Seniors Poverty Over the Age of 65 |
| Immigrants | Germany | 96.7 /100 | #94 | Exceptional 10.1% |
| Immigrants | Japan | 96.3 /100 | #95 | Exceptional 10.1% |
| Basques | 95.9 /100 | #96 | Exceptional 10.2% |
| Immigrants | Pakistan | 95.7 /100 | #97 | Exceptional 10.2% |
| Immigrants | Kuwait | 95.5 /100 | #98 | Exceptional 10.2% |
| Cypriots | 95.5 /100 | #99 | Exceptional 10.2% |
| Marshallese | 95.3 /100 | #100 | Exceptional 10.2% |
| Immigrants | Jordan | 94.7 /100 | #101 | Exceptional 10.2% |
| Delaware | 94.5 /100 | #102 | Exceptional 10.2% |
| Icelanders | 94.4 /100 | #103 | Exceptional 10.3% |
| South Africans | 94.3 /100 | #104 | Exceptional 10.3% |
| Aleuts | 94.1 /100 | #105 | Exceptional 10.3% |
| Kenyans | 94.1 /100 | #106 | Exceptional 10.3% |
| Hawaiians | 93.9 /100 | #107 | Exceptional 10.3% |
| Immigrants | Croatia | 93.9 /100 | #108 | Exceptional 10.3% |