Arab vs Immigrants from Bulgaria Child Poverty Under the Age of 16

COMPARE

Arab
Race
Ancestry
AfghanAfricanAlaska NativeAlaskan AthabascanAlbanianAleutAlsatianAmericanApacheArabArapahoArgentineanArmenianAssyrian/Chaldean/SyriacAustralianAustrianBahamianBangladeshiBarbadianBasqueBelgianBelizeanBermudanBhutaneseBlackfeetBolivianBrazilianBritishBritish West IndianBulgarianBurmeseCajunCambodianCanadianCape VerdeanCarpatho RusynCelticCentral AmericanCentral American IndianCherokeeCheyenneChickasawChileanChineseChippewaChoctawColombianColvilleComancheCosta RicanCreeCreekCroatianCrowCubanCypriotCzechCzechoslovakianDanishDelawareDominicanDutchDutch West IndianEastern EuropeanEcuadorianEgyptianEnglishEstonianEthiopianEuropeanFijianFilipinoFinnishFrenchFrench American IndianFrench CanadianGermanGerman RussianGhanaianGreekGuamanian/ChamorroGuatemalanGuyaneseHaitianHmongHonduranHopiHoumaHungarianIcelanderIndian (Asian)IndonesianInupiatIranianIraqiIrishIroquoisIsraeliItalianJamaicanJapaneseJordanianKenyanKiowaKoreanLaotianLatvianLebaneseLiberianLithuanianLumbeeLuxembourgerMacedonianMalaysianMalteseMarshalleseMenomineeMexicanMexican American IndianMongolianMoroccanNative HawaiianNavajoNepaleseNew ZealanderNicaraguanNigerianNorthern EuropeanNorwegianOkinawanOsageOttawaPaiutePakistaniPalestinianPanamanianParaguayanPennsylvania GermanPeruvianPimaPolishPortuguesePotawatomiPuebloPuerto RicanPuget Sound SalishRomanianRussianSalvadoranSamoanScandinavianScotch-IrishScottishSeminoleSenegaleseSerbianShoshoneSierra LeoneanSiouxSlavicSlovakSloveneSomaliSouth AfricanSouth AmericanSouth American IndianSoviet UnionSpaniardSpanishSpanish AmericanSpanish American IndianSri LankanSubsaharan AfricanSudaneseSwedishSwissSyrianTaiwaneseThaiTlingit-HaidaTohono O'OdhamTonganTrinidadian and TobagonianTsimshianTurkishU.S. Virgin IslanderUgandanUkrainianUruguayanUteVenezuelanVietnameseWelshWest IndianYakamaYaquiYugoslavianYumanYup'ikZimbabwean
Immigration
NonimmigrantsImmigrantsAfghanistanAfricaAlbaniaArgentinaArmeniaAsiaAustraliaAustriaBahamasBangladeshBarbadosBelarusBelgiumBelizeBoliviaBosnia and HerzegovinaBrazilBurma/MyanmarCabo VerdeCambodiaCameroonCanadaCaribbeanCentral AmericaChileChinaColombiaCongoCosta RicaCroatiaCubaCzechoslovakiaDenmarkDominicaDominican RepublicEastern AfricaEastern AsiaEastern EuropeEcuadorEgyptEl SalvadorEnglandEritreaEthiopiaEuropeFijiFranceGermanyGhanaGreeceGrenadaGuatemalaGuyanaHaitiHondurasHong KongHungaryIndiaIndonesiaIranIraqIrelandIsraelItalyJamaicaJapanJordanKazakhstanKenyaKoreaKuwaitLaosLatin AmericaLatviaLebanonLiberiaLithuaniaMalaysiaMexicoMicronesiaMiddle AfricaMoldovaMoroccoNepalNetherlandsNicaraguaNigeriaNorth AmericaNorth MacedoniaNorthern AfricaNorthern EuropeNorwayOceaniaPakistanPanamaPeruPhilippinesPolandPortugalRomaniaRussiaSaudi ArabiaScotlandSenegalSerbiaSierra LeoneSingaporeSomaliaSouth AfricaSouth AmericaSouth Central AsiaSouth Eastern AsiaSouthern EuropeSpainSri LankaSt. Vincent and the GrenadinesSudanSwedenSwitzerlandSyriaTaiwanThailandTrinidad and TobagoTurkeyUgandaUkraineUruguayUzbekistanVenezuelaVietnamWest IndiesWestern AfricaWestern AsiaWestern EuropeYemenZaireZimbabweAzores
Immigrants from Bulgaria
Race
Ancestry
AfghanAfricanAlaska NativeAlaskan AthabascanAlbanianAleutAlsatianAmericanApacheArapahoArgentineanArmenianAssyrian/Chaldean/SyriacAustralianAustrianBahamianBangladeshiBarbadianBasqueBelgianBelizeanBermudanBhutaneseBlackfeetBolivianBrazilianBritishBritish West IndianBulgarianBurmeseCajunCambodianCanadianCape VerdeanCarpatho RusynCelticCentral AmericanCentral American IndianCherokeeCheyenneChickasawChileanChineseChippewaChoctawColombianColvilleComancheCosta RicanCreeCreekCroatianCrowCubanCypriotCzechCzechoslovakianDanishDelawareDominicanDutchDutch West IndianEastern EuropeanEcuadorianEgyptianEnglishEstonianEthiopianEuropeanFijianFilipinoFinnishFrenchFrench American IndianFrench CanadianGermanGerman RussianGhanaianGreekGuamanian/ChamorroGuatemalanGuyaneseHaitianHmongHonduranHopiHoumaHungarianIcelanderIndian (Asian)IndonesianInupiatIranianIraqiIrishIroquoisIsraeliItalianJamaicanJapaneseJordanianKenyanKiowaKoreanLaotianLatvianLebaneseLiberianLithuanianLumbeeLuxembourgerMacedonianMalaysianMalteseMarshalleseMenomineeMexicanMexican American IndianMongolianMoroccanNative HawaiianNavajoNepaleseNew ZealanderNicaraguanNigerianNorthern EuropeanNorwegianOkinawanOsageOttawaPaiutePakistaniPalestinianPanamanianParaguayanPennsylvania GermanPeruvianPimaPolishPortuguesePotawatomiPuebloPuerto RicanPuget Sound SalishRomanianRussianSalvadoranSamoanScandinavianScotch-IrishScottishSeminoleSenegaleseSerbianShoshoneSierra LeoneanSiouxSlavicSlovakSloveneSomaliSouth AfricanSouth AmericanSouth American IndianSoviet UnionSpaniardSpanishSpanish AmericanSpanish American IndianSri LankanSubsaharan AfricanSudaneseSwedishSwissSyrianTaiwaneseThaiTlingit-HaidaTohono O'OdhamTonganTrinidadian and TobagonianTsimshianTurkishU.S. Virgin IslanderUgandanUkrainianUruguayanUteVenezuelanVietnameseWelshWest IndianYakamaYaquiYugoslavianYumanYup'ikZimbabwean
Immigration
NonimmigrantsImmigrantsAfghanistanAfricaAlbaniaArgentinaArmeniaAsiaAustraliaAustriaBahamasBangladeshBarbadosBelarusBelgiumBelizeBoliviaBosnia and HerzegovinaBrazilBulgariaBurma/MyanmarCabo VerdeCambodiaCameroonCanadaCaribbeanCentral AmericaChileChinaColombiaCongoCosta RicaCroatiaCubaCzechoslovakiaDenmarkDominicaDominican RepublicEastern AfricaEastern AsiaEastern EuropeEcuadorEgyptEl SalvadorEnglandEritreaEthiopiaEuropeFijiFranceGermanyGhanaGreeceGrenadaGuatemalaGuyanaHaitiHondurasHong KongHungaryIndiaIndonesiaIranIraqIrelandIsraelItalyJamaicaJapanJordanKazakhstanKenyaKoreaKuwaitLaosLatin AmericaLatviaLebanonLiberiaLithuaniaMalaysiaMexicoMicronesiaMiddle AfricaMoldovaMoroccoNepalNetherlandsNicaraguaNigeriaNorth AmericaNorth MacedoniaNorthern AfricaNorthern EuropeNorwayOceaniaPakistanPanamaPeruPhilippinesPolandPortugalRomaniaRussiaSaudi ArabiaScotlandSenegalSerbiaSierra LeoneSingaporeSomaliaSouth AfricaSouth AmericaSouth Central AsiaSouth Eastern AsiaSouthern EuropeSpainSri LankaSt. Vincent and the GrenadinesSudanSwedenSwitzerlandSyriaTaiwanThailandTrinidad and TobagoTurkeyUgandaUkraineUruguayUzbekistanVenezuelaVietnamWest IndiesWestern AfricaWestern AsiaWestern EuropeYemenZaireZimbabweAzores
Child Poverty Under the Age of 16
Income
Poverty
Unemployment
Labor Participation
Family Structure
Vehicle Availability
Education Level
Disability

Child Poverty Under the Age of 16 Comparison

Arabs

Immigrants from Bulgaria

Fair
Exceptional
16.6%
CHILD POVERTY UNDER THE AGE OF 16
31.4/ 100
METRIC RATING
187th/ 347
METRIC RANK
14.3%
CHILD POVERTY UNDER THE AGE OF 16
98.0/ 100
METRIC RATING
69th/ 347
METRIC RANK

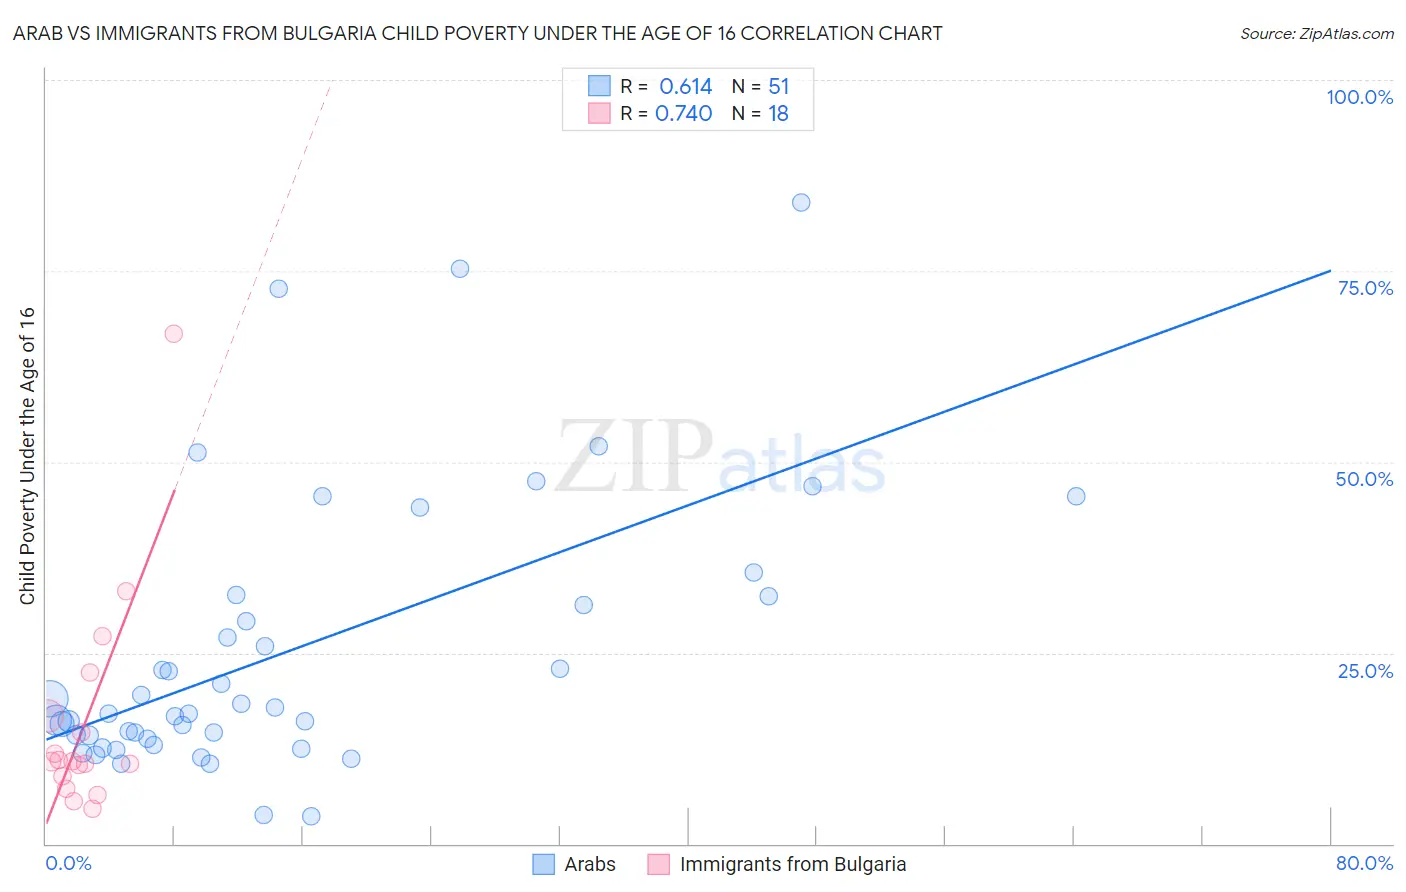
Arab vs Immigrants from Bulgaria Child Poverty Under the Age of 16 Correlation Chart

The statistical analysis conducted on geographies consisting of 480,274,092 people shows a significant positive correlation between the proportion of Arabs and poverty level among children under the age of 16 in the United States with a correlation coefficient (R) of 0.614 and weighted average of 16.6%. Similarly, the statistical analysis conducted on geographies consisting of 171,715,259 people shows a strong positive correlation between the proportion of Immigrants from Bulgaria and poverty level among children under the age of 16 in the United States with a correlation coefficient (R) of 0.740 and weighted average of 14.3%, a difference of 15.8%.
Arab vs Immigrants from Bulgaria Child Poverty Under the Age of 16

Child Poverty Under the Age of 16 Correlation Summary

MeasurementArabImmigrants from Bulgaria
Minimum3.6%4.6%
Maximum84.0%66.8%
Range80.4%62.2%
Mean25.2%16.1%
Median17.1%10.8%
Interquartile 25% (IQ1)13.8%8.9%
Interquartile 75% (IQ3)32.4%16.8%
Interquartile Range (IQR)18.6%7.9%
Standard Deviation (Sample)18.1%14.7%
Standard Deviation (Population)17.9%14.3%

Similar Demographics by Child Poverty Under the Age of 16

Demographics Similar to Arabs by Child Poverty Under the Age of 16

In terms of child poverty under the age of 16, the demographic groups most similar to Arabs are Immigrants from Morocco (16.6%, a difference of 0.020%), Immigrants from Portugal (16.6%, a difference of 0.19%), Immigrants from Costa Rica (16.6%, a difference of 0.24%), Kenyan (16.5%, a difference of 0.36%), and Immigrants from Iraq (16.7%, a difference of 0.44%).
DemographicsRating | RankChild Poverty Under the Age of 16
South American Indians
41.8
/100
|
#180
Average
16.4%
Immigrants | South America
40.8
/100
|
#181
Average
16.4%
Hawaiians
38.2
/100
|
#182
Fair
16.4%
Celtics
38.2
/100
|
#183
Fair
16.4%
Immigrants | Western Asia
38.0
/100
|
#184
Fair
16.4%
Immigrants | Bosnia and Herzegovina
37.4
/100
|
#185
Fair
16.5%
Kenyans
34.1
/100
|
#186
Fair
16.5%
Arabs
31.4
/100
|
#187
Fair
16.6%
Immigrants | Morocco
31.2
/100
|
#188
Fair
16.6%
Immigrants | Portugal
30.0
/100
|
#189
Fair
16.6%
Immigrants | Costa Rica
29.6
/100
|
#190
Fair
16.6%
Immigrants | Iraq
28.3
/100
|
#191
Fair
16.7%
Spanish
24.5
/100
|
#192
Fair
16.7%
Spaniards
23.2
/100
|
#193
Fair
16.8%
Immigrants | Uruguay
23.1
/100
|
#194
Fair
16.8%

Demographics Similar to Immigrants from Bulgaria by Child Poverty Under the Age of 16

In terms of child poverty under the age of 16, the demographic groups most similar to Immigrants from Bulgaria are Laotian (14.3%, a difference of 0.080%), Immigrants from Netherlands (14.3%, a difference of 0.10%), Immigrants from Poland (14.3%, a difference of 0.11%), European (14.3%, a difference of 0.18%), and Slovene (14.3%, a difference of 0.21%).
DemographicsRating | RankChild Poverty Under the Age of 16
Zimbabweans
98.5
/100
|
#62
Exceptional
14.2%
Immigrants | Europe
98.4
/100
|
#63
Exceptional
14.2%
Immigrants | Romania
98.3
/100
|
#64
Exceptional
14.2%
Immigrants | Philippines
98.2
/100
|
#65
Exceptional
14.3%
Slovenes
98.1
/100
|
#66
Exceptional
14.3%
Europeans
98.1
/100
|
#67
Exceptional
14.3%
Laotians
98.0
/100
|
#68
Exceptional
14.3%
Immigrants | Bulgaria
98.0
/100
|
#69
Exceptional
14.3%
Immigrants | Netherlands
97.9
/100
|
#70
Exceptional
14.3%
Immigrants | Poland
97.9
/100
|
#71
Exceptional
14.3%
Cambodians
97.8
/100
|
#72
Exceptional
14.4%
Immigrants | Turkey
97.6
/100
|
#73
Exceptional
14.4%
Macedonians
97.6
/100
|
#74
Exceptional
14.4%
Ukrainians
97.5
/100
|
#75
Exceptional
14.4%
Immigrants | Eastern Europe
97.5
/100
|
#76
Exceptional
14.4%