Apache vs Jordanian Child Poverty Among Boys Under 16
COMPARE
Apache
Jordanian
Child Poverty Among Boys Under 16
Child Poverty Among Boys Under 16 Comparison
Apache
Jordanians
24.5%
CHILD POVERTY AMONG BOYS UNDER 16
0.0/ 100
METRIC RATING
333rd/ 347
METRIC RANK
15.1%
CHILD POVERTY AMONG BOYS UNDER 16
95.1/ 100
METRIC RATING
107th/ 347
METRIC RANK
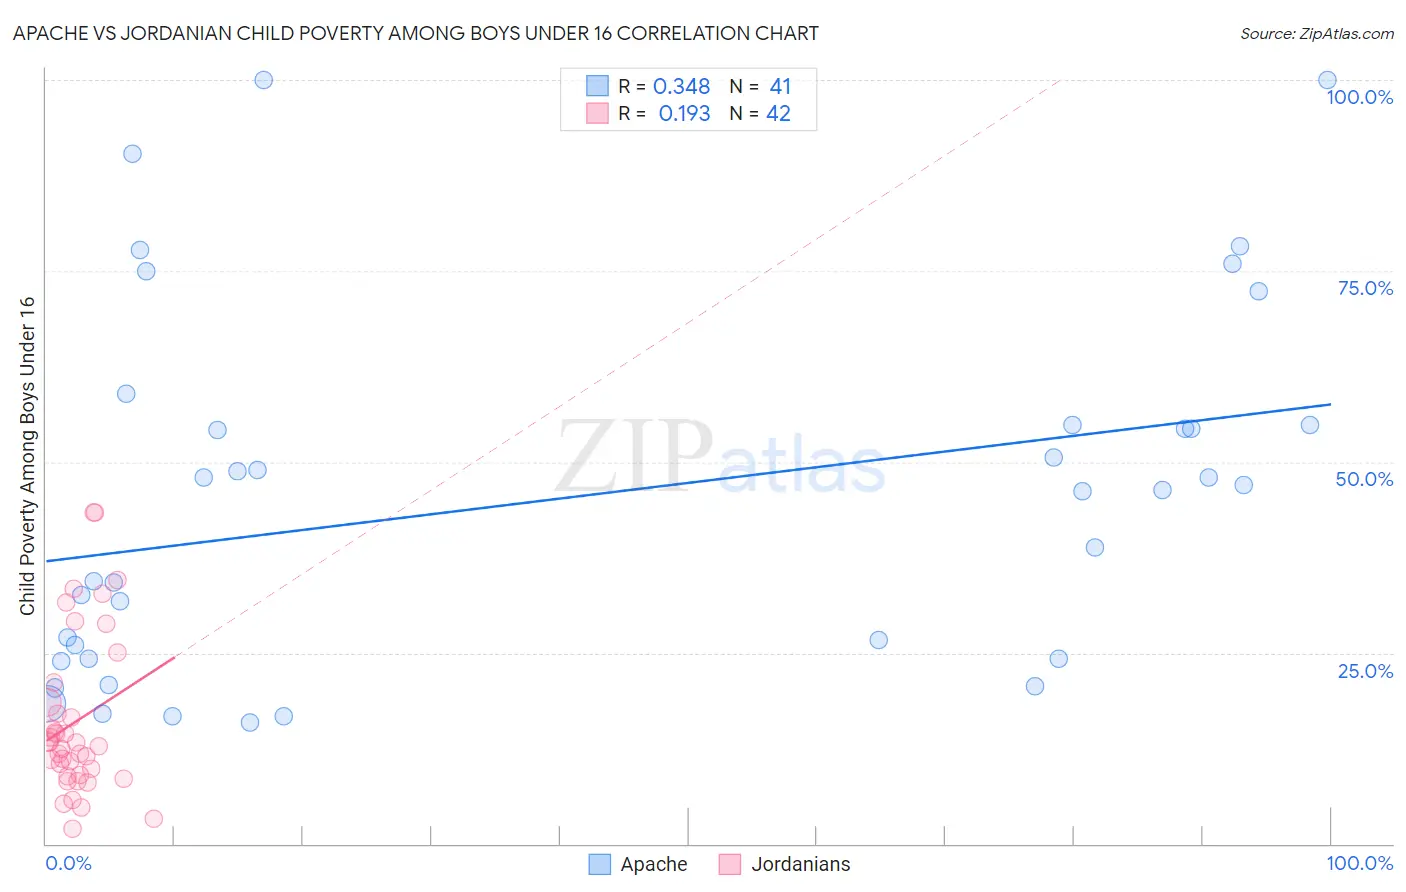
Apache vs Jordanian Child Poverty Among Boys Under 16 Correlation Chart
The statistical analysis conducted on geographies consisting of 229,742,001 people shows a mild positive correlation between the proportion of Apache and poverty level among boys under the age of 16 in the United States with a correlation coefficient (R) of 0.348 and weighted average of 24.5%. Similarly, the statistical analysis conducted on geographies consisting of 165,479,889 people shows a poor positive correlation between the proportion of Jordanians and poverty level among boys under the age of 16 in the United States with a correlation coefficient (R) of 0.193 and weighted average of 15.1%, a difference of 62.5%.
Child Poverty Among Boys Under 16 Correlation Summary
| Measurement | Apache | Jordanian |
| Minimum | 15.9% | 1.9% |
| Maximum | 100.0% | 43.3% |
| Range | 84.1% | 41.4% |
| Mean | 45.2% | 16.0% |
| Median | 46.3% | 13.0% |
| Interquartile 25% (IQ1) | 24.3% | 9.0% |
| Interquartile 75% (IQ3) | 54.8% | 18.5% |
| Interquartile Range (IQR) | 30.6% | 9.5% |
| Standard Deviation (Sample) | 23.6% | 10.4% |
| Standard Deviation (Population) | 23.3% | 10.3% |
Similar Demographics by Child Poverty Among Boys Under 16
Demographics Similar to Apache by Child Poverty Among Boys Under 16
In terms of child poverty among boys under 16, the demographic groups most similar to Apache are Black/African American (24.5%, a difference of 0.12%), Immigrants from Dominican Republic (24.3%, a difference of 0.72%), Yup'ik (24.7%, a difference of 0.97%), Dominican (24.2%, a difference of 1.3%), and Colville (24.1%, a difference of 1.7%).
| Demographics | Rating | Rank | Child Poverty Among Boys Under 16 |
| Paiute | 0.0 /100 | #326 | Tragic 22.8% |
| Immigrants | Honduras | 0.0 /100 | #327 | Tragic 22.8% |
| Pueblo | 0.0 /100 | #328 | Tragic 23.5% |
| Natives/Alaskans | 0.0 /100 | #329 | Tragic 24.0% |
| Colville | 0.0 /100 | #330 | Tragic 24.1% |
| Dominicans | 0.0 /100 | #331 | Tragic 24.2% |
| Immigrants | Dominican Republic | 0.0 /100 | #332 | Tragic 24.3% |
| Apache | 0.0 /100 | #333 | Tragic 24.5% |
| Blacks/African Americans | 0.0 /100 | #334 | Tragic 24.5% |
| Yup'ik | 0.0 /100 | #335 | Tragic 24.7% |
| Sioux | 0.0 /100 | #336 | Tragic 25.3% |
| Cheyenne | 0.0 /100 | #337 | Tragic 25.8% |
| Hopi | 0.0 /100 | #338 | Tragic 25.9% |
| Houma | 0.0 /100 | #339 | Tragic 26.2% |
| Crow | 0.0 /100 | #340 | Tragic 26.3% |
Demographics Similar to Jordanians by Child Poverty Among Boys Under 16
In terms of child poverty among boys under 16, the demographic groups most similar to Jordanians are Serbian (15.1%, a difference of 0.11%), Immigrants from England (15.1%, a difference of 0.17%), Pakistani (15.1%, a difference of 0.21%), Dutch (15.0%, a difference of 0.22%), and Immigrants from Switzerland (15.0%, a difference of 0.24%).
| Demographics | Rating | Rank | Child Poverty Among Boys Under 16 |
| Chileans | 95.8 /100 | #100 | Exceptional 15.0% |
| Immigrants | Belarus | 95.7 /100 | #101 | Exceptional 15.0% |
| Romanians | 95.6 /100 | #102 | Exceptional 15.0% |
| Immigrants | Denmark | 95.6 /100 | #103 | Exceptional 15.0% |
| Immigrants | Switzerland | 95.4 /100 | #104 | Exceptional 15.0% |
| Dutch | 95.4 /100 | #105 | Exceptional 15.0% |
| Serbians | 95.2 /100 | #106 | Exceptional 15.1% |
| Jordanians | 95.1 /100 | #107 | Exceptional 15.1% |
| Immigrants | England | 94.8 /100 | #108 | Exceptional 15.1% |
| Pakistanis | 94.7 /100 | #109 | Exceptional 15.1% |
| English | 94.3 /100 | #110 | Exceptional 15.1% |
| Immigrants | Zimbabwe | 94.2 /100 | #111 | Exceptional 15.2% |
| Basques | 93.8 /100 | #112 | Exceptional 15.2% |
| Irish | 93.8 /100 | #113 | Exceptional 15.2% |
| Immigrants | Ukraine | 93.6 /100 | #114 | Exceptional 15.2% |