American vs Immigrants from West Indies Child Poverty Under the Age of 16

COMPARE

American
Race
Ancestry
AfghanAfricanAlaska NativeAlaskan AthabascanAlbanianAleutAlsatianAmericanApacheArabArapahoArgentineanArmenianAssyrian/Chaldean/SyriacAustralianAustrianBahamianBangladeshiBarbadianBasqueBelgianBelizeanBermudanBhutaneseBlackfeetBolivianBrazilianBritishBritish West IndianBulgarianBurmeseCajunCambodianCanadianCape VerdeanCarpatho RusynCelticCentral AmericanCentral American IndianCherokeeCheyenneChickasawChileanChineseChippewaChoctawColombianColvilleComancheCosta RicanCreeCreekCroatianCrowCubanCypriotCzechCzechoslovakianDanishDelawareDominicanDutchDutch West IndianEastern EuropeanEcuadorianEgyptianEnglishEstonianEthiopianEuropeanFijianFilipinoFinnishFrenchFrench American IndianFrench CanadianGermanGerman RussianGhanaianGreekGuamanian/ChamorroGuatemalanGuyaneseHaitianHmongHonduranHopiHoumaHungarianIcelanderIndian (Asian)IndonesianInupiatIranianIraqiIrishIroquoisIsraeliItalianJamaicanJapaneseJordanianKenyanKiowaKoreanLaotianLatvianLebaneseLiberianLithuanianLumbeeLuxembourgerMacedonianMalaysianMalteseMarshalleseMenomineeMexicanMexican American IndianMongolianMoroccanNative HawaiianNavajoNepaleseNew ZealanderNicaraguanNigerianNorthern EuropeanNorwegianOkinawanOsageOttawaPaiutePakistaniPalestinianPanamanianParaguayanPennsylvania GermanPeruvianPimaPolishPortuguesePotawatomiPuebloPuerto RicanPuget Sound SalishRomanianRussianSalvadoranSamoanScandinavianScotch-IrishScottishSeminoleSenegaleseSerbianShoshoneSierra LeoneanSiouxSlavicSlovakSloveneSomaliSouth AfricanSouth AmericanSouth American IndianSoviet UnionSpaniardSpanishSpanish AmericanSpanish American IndianSri LankanSubsaharan AfricanSudaneseSwedishSwissSyrianTaiwaneseThaiTlingit-HaidaTohono O'OdhamTonganTrinidadian and TobagonianTsimshianTurkishU.S. Virgin IslanderUgandanUkrainianUruguayanUteVenezuelanVietnameseWelshWest IndianYakamaYaquiYugoslavianYumanYup'ikZimbabwean
Immigration
NonimmigrantsImmigrantsAfghanistanAfricaAlbaniaArgentinaArmeniaAsiaAustraliaAustriaBahamasBangladeshBarbadosBelarusBelgiumBelizeBoliviaBosnia and HerzegovinaBrazilBulgariaBurma/MyanmarCabo VerdeCambodiaCameroonCanadaCaribbeanCentral AmericaChileChinaColombiaCongoCosta RicaCroatiaCubaCzechoslovakiaDenmarkDominicaDominican RepublicEastern AfricaEastern AsiaEastern EuropeEcuadorEgyptEl SalvadorEnglandEritreaEthiopiaEuropeFijiFranceGermanyGhanaGreeceGrenadaGuatemalaGuyanaHaitiHondurasHong KongHungaryIndiaIndonesiaIranIraqIrelandIsraelItalyJamaicaJapanJordanKazakhstanKenyaKoreaKuwaitLaosLatin AmericaLatviaLebanonLiberiaLithuaniaMalaysiaMexicoMicronesiaMiddle AfricaMoldovaMoroccoNepalNetherlandsNicaraguaNigeriaNorth AmericaNorth MacedoniaNorthern AfricaNorthern EuropeNorwayOceaniaPakistanPanamaPeruPhilippinesPolandPortugalRomaniaRussiaSaudi ArabiaScotlandSenegalSerbiaSierra LeoneSingaporeSomaliaSouth AfricaSouth AmericaSouth Central AsiaSouth Eastern AsiaSouthern EuropeSpainSri LankaSt. Vincent and the GrenadinesSudanSwedenSwitzerlandSyriaTaiwanThailandTrinidad and TobagoTurkeyUgandaUkraineUruguayUzbekistanVenezuelaVietnamWestern AfricaWestern AsiaWestern EuropeYemenZaireZimbabweAzores
Immigrants from West Indies
Race
Ancestry
AfghanAfricanAlaska NativeAlaskan AthabascanAlbanianAleutAlsatianApacheArabArapahoArgentineanArmenianAssyrian/Chaldean/SyriacAustralianAustrianBahamianBangladeshiBarbadianBasqueBelgianBelizeanBermudanBhutaneseBlackfeetBolivianBrazilianBritishBritish West IndianBulgarianBurmeseCajunCambodianCanadianCape VerdeanCarpatho RusynCelticCentral AmericanCentral American IndianCherokeeCheyenneChickasawChileanChineseChippewaChoctawColombianColvilleComancheCosta RicanCreeCreekCroatianCrowCubanCypriotCzechCzechoslovakianDanishDelawareDominicanDutchDutch West IndianEastern EuropeanEcuadorianEgyptianEnglishEstonianEthiopianEuropeanFijianFilipinoFinnishFrenchFrench American IndianFrench CanadianGermanGerman RussianGhanaianGreekGuamanian/ChamorroGuatemalanGuyaneseHaitianHmongHonduranHopiHoumaHungarianIcelanderIndian (Asian)IndonesianInupiatIranianIraqiIrishIroquoisIsraeliItalianJamaicanJapaneseJordanianKenyanKiowaKoreanLaotianLatvianLebaneseLiberianLithuanianLumbeeLuxembourgerMacedonianMalaysianMalteseMarshalleseMenomineeMexicanMexican American IndianMongolianMoroccanNative HawaiianNavajoNepaleseNew ZealanderNicaraguanNigerianNorthern EuropeanNorwegianOkinawanOsageOttawaPaiutePakistaniPalestinianPanamanianParaguayanPennsylvania GermanPeruvianPimaPolishPortuguesePotawatomiPuebloPuerto RicanPuget Sound SalishRomanianRussianSalvadoranSamoanScandinavianScotch-IrishScottishSeminoleSenegaleseSerbianShoshoneSierra LeoneanSiouxSlavicSlovakSloveneSomaliSouth AfricanSouth AmericanSouth American IndianSoviet UnionSpaniardSpanishSpanish AmericanSpanish American IndianSri LankanSubsaharan AfricanSudaneseSwedishSwissSyrianTaiwaneseThaiTlingit-HaidaTohono O'OdhamTonganTrinidadian and TobagonianTsimshianTurkishU.S. Virgin IslanderUgandanUkrainianUruguayanUteVenezuelanVietnameseWelshWest IndianYakamaYaquiYugoslavianYumanYup'ikZimbabwean
Immigration
NonimmigrantsImmigrantsAfghanistanAfricaAlbaniaArgentinaArmeniaAsiaAustraliaAustriaBahamasBangladeshBarbadosBelarusBelgiumBelizeBoliviaBosnia and HerzegovinaBrazilBulgariaBurma/MyanmarCabo VerdeCambodiaCameroonCanadaCaribbeanCentral AmericaChileChinaColombiaCongoCosta RicaCroatiaCubaCzechoslovakiaDenmarkDominicaDominican RepublicEastern AfricaEastern AsiaEastern EuropeEcuadorEgyptEl SalvadorEnglandEritreaEthiopiaEuropeFijiFranceGermanyGhanaGreeceGrenadaGuatemalaGuyanaHaitiHondurasHong KongHungaryIndiaIndonesiaIranIraqIrelandIsraelItalyJamaicaJapanJordanKazakhstanKenyaKoreaKuwaitLaosLatin AmericaLatviaLebanonLiberiaLithuaniaMalaysiaMexicoMicronesiaMiddle AfricaMoldovaMoroccoNepalNetherlandsNicaraguaNigeriaNorth AmericaNorth MacedoniaNorthern AfricaNorthern EuropeNorwayOceaniaPakistanPanamaPeruPhilippinesPolandPortugalRomaniaRussiaSaudi ArabiaScotlandSenegalSerbiaSierra LeoneSingaporeSomaliaSouth AfricaSouth AmericaSouth Central AsiaSouth Eastern AsiaSouthern EuropeSpainSri LankaSt. Vincent and the GrenadinesSudanSwedenSwitzerlandSyriaTaiwanThailandTrinidad and TobagoTurkeyUgandaUkraineUruguayUzbekistanVenezuelaVietnamWest IndiesWestern AfricaWestern AsiaWestern EuropeYemenZaireZimbabweAzores
Child Poverty Under the Age of 16
Income
Poverty
Unemployment
Labor Participation
Family Structure
Vehicle Availability
Education Level
Disability

Child Poverty Under the Age of 16 Comparison

Americans

Immigrants from West Indies

Tragic
Tragic
18.3%
CHILD POVERTY UNDER THE AGE OF 16
1.2/ 100
METRIC RATING
232nd/ 347
METRIC RANK
20.2%
CHILD POVERTY UNDER THE AGE OF 16
0.0/ 100
METRIC RATING
286th/ 347
METRIC RANK

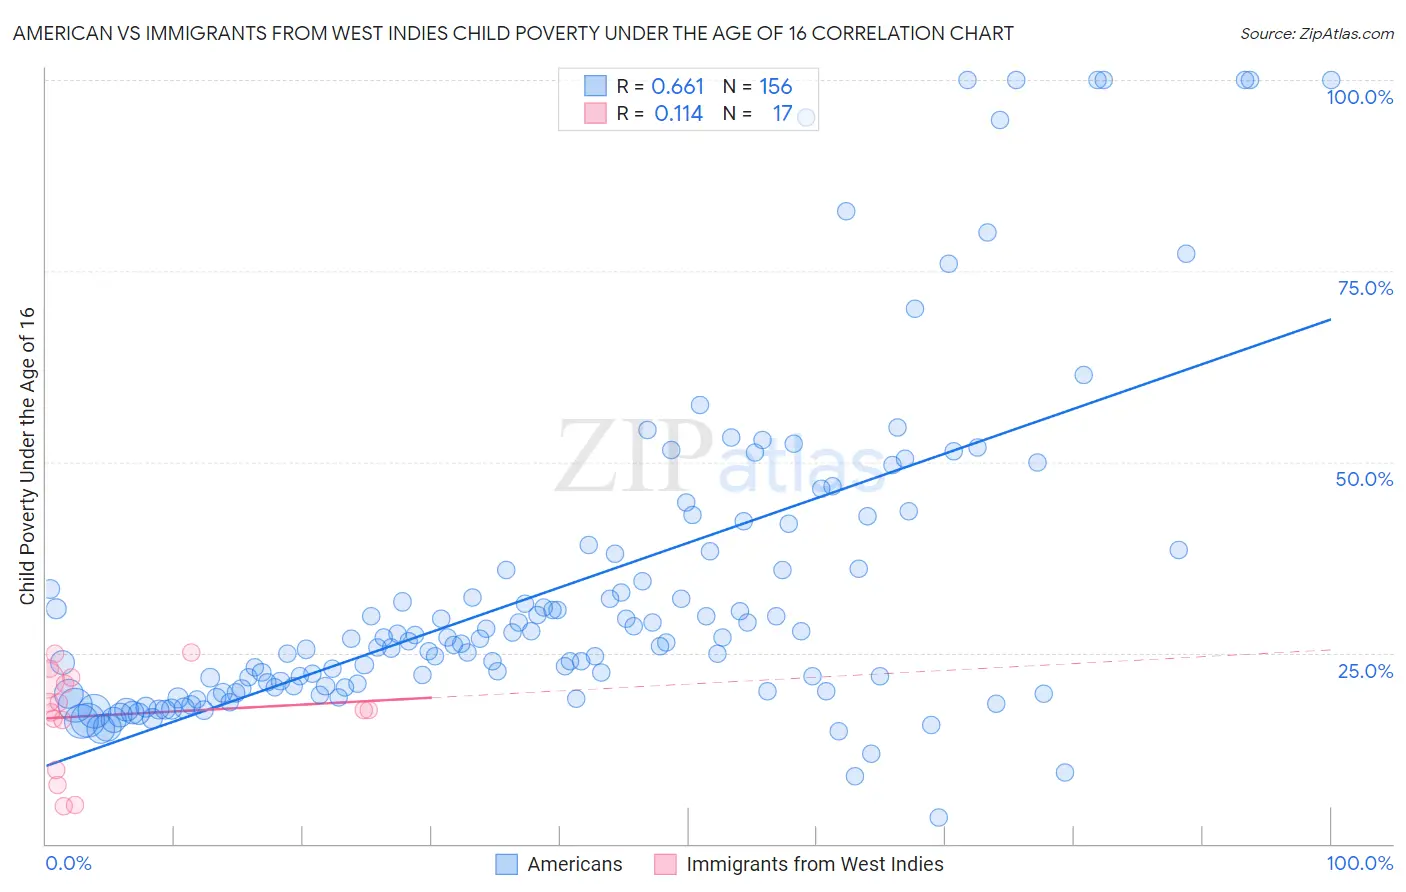
American vs Immigrants from West Indies Child Poverty Under the Age of 16 Correlation Chart

The statistical analysis conducted on geographies consisting of 567,812,680 people shows a significant positive correlation between the proportion of Americans and poverty level among children under the age of 16 in the United States with a correlation coefficient (R) of 0.661 and weighted average of 18.3%. Similarly, the statistical analysis conducted on geographies consisting of 72,404,879 people shows a poor positive correlation between the proportion of Immigrants from West Indies and poverty level among children under the age of 16 in the United States with a correlation coefficient (R) of 0.114 and weighted average of 20.2%, a difference of 10.0%.
American vs Immigrants from West Indies Child Poverty Under the Age of 16

Child Poverty Under the Age of 16 Correlation Summary

MeasurementAmericanImmigrants from West Indies
Minimum3.4%5.0%
Maximum100.0%25.0%
Range96.6%20.0%
Mean33.5%16.8%
Median26.4%17.5%
Interquartile 25% (IQ1)20.2%12.9%
Interquartile 75% (IQ3)38.2%21.6%
Interquartile Range (IQR)18.0%8.6%
Standard Deviation (Sample)21.4%6.4%
Standard Deviation (Population)21.3%6.2%

Similar Demographics by Child Poverty Under the Age of 16

Demographics Similar to Americans by Child Poverty Under the Age of 16

In terms of child poverty under the age of 16, the demographic groups most similar to Americans are Fijian (18.4%, a difference of 0.22%), Immigrants from Nigeria (18.4%, a difference of 0.47%), Nigerian (18.4%, a difference of 0.53%), Cree (18.5%, a difference of 0.82%), and Sudanese (18.5%, a difference of 0.85%).
DemographicsRating | RankChild Poverty Under the Age of 16
Immigrants | Nonimmigrants
2.7
/100
|
#225
Tragic
17.9%
Bermudans
2.6
/100
|
#226
Tragic
18.0%
Immigrants | Africa
2.5
/100
|
#227
Tragic
18.0%
Immigrants | Micronesia
2.3
/100
|
#228
Tragic
18.0%
Marshallese
1.8
/100
|
#229
Tragic
18.1%
Nepalese
1.7
/100
|
#230
Tragic
18.2%
Nicaraguans
1.7
/100
|
#231
Tragic
18.2%
Americans
1.2
/100
|
#232
Tragic
18.3%
Fijians
1.1
/100
|
#233
Tragic
18.4%
Immigrants | Nigeria
1.0
/100
|
#234
Tragic
18.4%
Nigerians
1.0
/100
|
#235
Tragic
18.4%
Cree
0.9
/100
|
#236
Tragic
18.5%
Sudanese
0.9
/100
|
#237
Tragic
18.5%
Immigrants | Eritrea
0.8
/100
|
#238
Tragic
18.5%
Immigrants | Sudan
0.8
/100
|
#239
Tragic
18.5%

Demographics Similar to Immigrants from West Indies by Child Poverty Under the Age of 16

In terms of child poverty under the age of 16, the demographic groups most similar to Immigrants from West Indies are Blackfeet (20.2%, a difference of 0.12%), Immigrants from St. Vincent and the Grenadines (20.1%, a difference of 0.14%), West Indian (20.1%, a difference of 0.20%), Immigrants from Zaire (20.1%, a difference of 0.35%), and Barbadian (20.0%, a difference of 0.57%).
DemographicsRating | RankChild Poverty Under the Age of 16
Sub-Saharan Africans
0.0
/100
|
#279
Tragic
19.9%
Comanche
0.0
/100
|
#280
Tragic
19.9%
Central Americans
0.0
/100
|
#281
Tragic
20.0%
Barbadians
0.0
/100
|
#282
Tragic
20.0%
Immigrants | Zaire
0.0
/100
|
#283
Tragic
20.1%
West Indians
0.0
/100
|
#284
Tragic
20.1%
Immigrants | St. Vincent and the Grenadines
0.0
/100
|
#285
Tragic
20.1%
Immigrants | West Indies
0.0
/100
|
#286
Tragic
20.2%
Blackfeet
0.0
/100
|
#287
Tragic
20.2%
Immigrants | Belize
0.0
/100
|
#288
Tragic
20.3%
Senegalese
0.0
/100
|
#289
Tragic
20.4%
Yaqui
0.0
/100
|
#290
Tragic
20.4%
Chippewa
0.0
/100
|
#291
Tragic
20.5%
Immigrants | Latin America
0.0
/100
|
#292
Tragic
20.5%
Immigrants | Senegal
0.0
/100
|
#293
Tragic
20.6%