Alaskan Athabascan vs Immigrants from Barbados Poverty

COMPARE

Alaskan Athabascan
Race
Ancestry
AfghanAfricanAlaska NativeAlaskan AthabascanAlbanianAleutAlsatianAmericanApacheArabArapahoArgentineanArmenianAssyrian/Chaldean/SyriacAustralianAustrianBahamianBangladeshiBarbadianBasqueBelgianBelizeanBermudanBhutaneseBlackfeetBolivianBrazilianBritishBritish West IndianBulgarianBurmeseCajunCambodianCanadianCape VerdeanCarpatho RusynCelticCentral AmericanCentral American IndianCherokeeCheyenneChickasawChileanChineseChippewaChoctawColombianColvilleComancheCosta RicanCreeCreekCroatianCrowCubanCypriotCzechCzechoslovakianDanishDelawareDominicanDutchDutch West IndianEastern EuropeanEcuadorianEgyptianEnglishEstonianEthiopianEuropeanFijianFilipinoFinnishFrenchFrench American IndianFrench CanadianGermanGerman RussianGhanaianGreekGuamanian/ChamorroGuatemalanGuyaneseHaitianHmongHonduranHopiHoumaHungarianIcelanderIndian (Asian)IndonesianInupiatIranianIraqiIrishIroquoisIsraeliItalianJamaicanJapaneseJordanianKenyanKiowaKoreanLaotianLatvianLebaneseLiberianLithuanianLumbeeLuxembourgerMacedonianMalaysianMalteseMarshalleseMenomineeMexicanMexican American IndianMongolianMoroccanNative HawaiianNavajoNepaleseNew ZealanderNicaraguanNigerianNorthern EuropeanNorwegianOkinawanOsageOttawaPaiutePakistaniPalestinianPanamanianParaguayanPennsylvania GermanPeruvianPimaPolishPortuguesePotawatomiPuebloPuerto RicanPuget Sound SalishRomanianRussianSalvadoranSamoanScandinavianScotch-IrishScottishSeminoleSenegaleseSerbianShoshoneSierra LeoneanSiouxSlavicSlovakSloveneSomaliSouth AfricanSouth AmericanSouth American IndianSoviet UnionSpaniardSpanishSpanish AmericanSpanish American IndianSri LankanSubsaharan AfricanSudaneseSwedishSwissSyrianTaiwaneseThaiTlingit-HaidaTohono O'OdhamTonganTrinidadian and TobagonianTsimshianTurkishU.S. Virgin IslanderUgandanUkrainianUruguayanUteVenezuelanVietnameseWelshWest IndianYakamaYaquiYugoslavianYumanYup'ikZimbabwean
Immigration
NonimmigrantsImmigrantsAfghanistanAfricaAlbaniaArgentinaArmeniaAsiaAustraliaAustriaBahamasBangladeshBelarusBelgiumBelizeBoliviaBosnia and HerzegovinaBrazilBulgariaBurma/MyanmarCabo VerdeCambodiaCameroonCanadaCaribbeanCentral AmericaChileChinaColombiaCongoCosta RicaCroatiaCubaCzechoslovakiaDenmarkDominicaDominican RepublicEastern AfricaEastern AsiaEastern EuropeEcuadorEgyptEl SalvadorEnglandEritreaEthiopiaEuropeFijiFranceGermanyGhanaGreeceGrenadaGuatemalaGuyanaHaitiHondurasHong KongHungaryIndiaIndonesiaIranIraqIrelandIsraelItalyJamaicaJapanJordanKazakhstanKenyaKoreaKuwaitLaosLatin AmericaLatviaLebanonLiberiaLithuaniaMalaysiaMexicoMicronesiaMiddle AfricaMoldovaMoroccoNepalNetherlandsNicaraguaNigeriaNorth AmericaNorth MacedoniaNorthern AfricaNorthern EuropeNorwayOceaniaPakistanPanamaPeruPhilippinesPolandPortugalRomaniaRussiaSaudi ArabiaScotlandSenegalSerbiaSierra LeoneSingaporeSomaliaSouth AfricaSouth AmericaSouth Central AsiaSouth Eastern AsiaSouthern EuropeSpainSri LankaSt. Vincent and the GrenadinesSudanSwedenSwitzerlandSyriaTaiwanThailandTrinidad and TobagoTurkeyUgandaUkraineUruguayUzbekistanVenezuelaVietnamWest IndiesWestern AfricaWestern AsiaWestern EuropeYemenZaireZimbabweAzores
Immigrants from Barbados
Race
Ancestry
AfghanAfricanAlaska NativeAlbanianAleutAlsatianAmericanApacheArabArapahoArgentineanArmenianAssyrian/Chaldean/SyriacAustralianAustrianBahamianBangladeshiBarbadianBasqueBelgianBelizeanBermudanBhutaneseBlackfeetBolivianBrazilianBritishBritish West IndianBulgarianBurmeseCajunCambodianCanadianCape VerdeanCarpatho RusynCelticCentral AmericanCentral American IndianCherokeeCheyenneChickasawChileanChineseChippewaChoctawColombianColvilleComancheCosta RicanCreeCreekCroatianCrowCubanCypriotCzechCzechoslovakianDanishDelawareDominicanDutchDutch West IndianEastern EuropeanEcuadorianEgyptianEnglishEstonianEthiopianEuropeanFijianFilipinoFinnishFrenchFrench American IndianFrench CanadianGermanGerman RussianGhanaianGreekGuamanian/ChamorroGuatemalanGuyaneseHaitianHmongHonduranHopiHoumaHungarianIcelanderIndian (Asian)IndonesianInupiatIranianIraqiIrishIroquoisIsraeliItalianJamaicanJapaneseJordanianKenyanKiowaKoreanLaotianLatvianLebaneseLiberianLithuanianLumbeeLuxembourgerMacedonianMalaysianMalteseMarshalleseMenomineeMexicanMexican American IndianMongolianMoroccanNative HawaiianNavajoNepaleseNew ZealanderNicaraguanNigerianNorthern EuropeanNorwegianOkinawanOsageOttawaPaiutePakistaniPalestinianPanamanianParaguayanPennsylvania GermanPeruvianPimaPolishPortuguesePotawatomiPuebloPuerto RicanPuget Sound SalishRomanianRussianSalvadoranSamoanScandinavianScotch-IrishScottishSeminoleSenegaleseSerbianShoshoneSierra LeoneanSiouxSlavicSlovakSloveneSomaliSouth AfricanSouth AmericanSouth American IndianSoviet UnionSpaniardSpanishSpanish AmericanSpanish American IndianSri LankanSubsaharan AfricanSudaneseSwedishSwissSyrianTaiwaneseThaiTlingit-HaidaTohono O'OdhamTonganTrinidadian and TobagonianTsimshianTurkishU.S. Virgin IslanderUgandanUkrainianUruguayanUteVenezuelanVietnameseWelshWest IndianYakamaYaquiYugoslavianYumanYup'ikZimbabwean
Immigration
NonimmigrantsImmigrantsAfghanistanAfricaAlbaniaArgentinaArmeniaAsiaAustraliaAustriaBahamasBangladeshBarbadosBelarusBelgiumBelizeBoliviaBosnia and HerzegovinaBrazilBulgariaBurma/MyanmarCabo VerdeCambodiaCameroonCanadaCaribbeanCentral AmericaChileChinaColombiaCongoCosta RicaCroatiaCubaCzechoslovakiaDenmarkDominicaDominican RepublicEastern AfricaEastern AsiaEastern EuropeEcuadorEgyptEl SalvadorEnglandEritreaEthiopiaEuropeFijiFranceGermanyGhanaGreeceGrenadaGuatemalaGuyanaHaitiHondurasHong KongHungaryIndiaIndonesiaIranIraqIrelandIsraelItalyJamaicaJapanJordanKazakhstanKenyaKoreaKuwaitLaosLatin AmericaLatviaLebanonLiberiaLithuaniaMalaysiaMexicoMicronesiaMiddle AfricaMoldovaMoroccoNepalNetherlandsNicaraguaNigeriaNorth AmericaNorth MacedoniaNorthern AfricaNorthern EuropeNorwayOceaniaPakistanPanamaPeruPhilippinesPolandPortugalRomaniaRussiaSaudi ArabiaScotlandSenegalSerbiaSierra LeoneSingaporeSomaliaSouth AfricaSouth AmericaSouth Central AsiaSouth Eastern AsiaSouthern EuropeSpainSri LankaSt. Vincent and the GrenadinesSudanSwedenSwitzerlandSyriaTaiwanThailandTrinidad and TobagoTurkeyUgandaUkraineUruguayUzbekistanVenezuelaVietnamWest IndiesWestern AfricaWestern AsiaWestern EuropeYemenZaireZimbabweAzores
Poverty
Income
Poverty
Unemployment
Labor Participation
Family Structure
Vehicle Availability
Education Level
Disability

Poverty Comparison

Alaskan Athabascans

Immigrants from Barbados

Tragic
Tragic
13.6%
POVERTY
1.5/ 100
METRIC RATING
230th/ 347
METRIC RANK
14.9%
POVERTY
0.0/ 100
METRIC RATING
281st/ 347
METRIC RANK

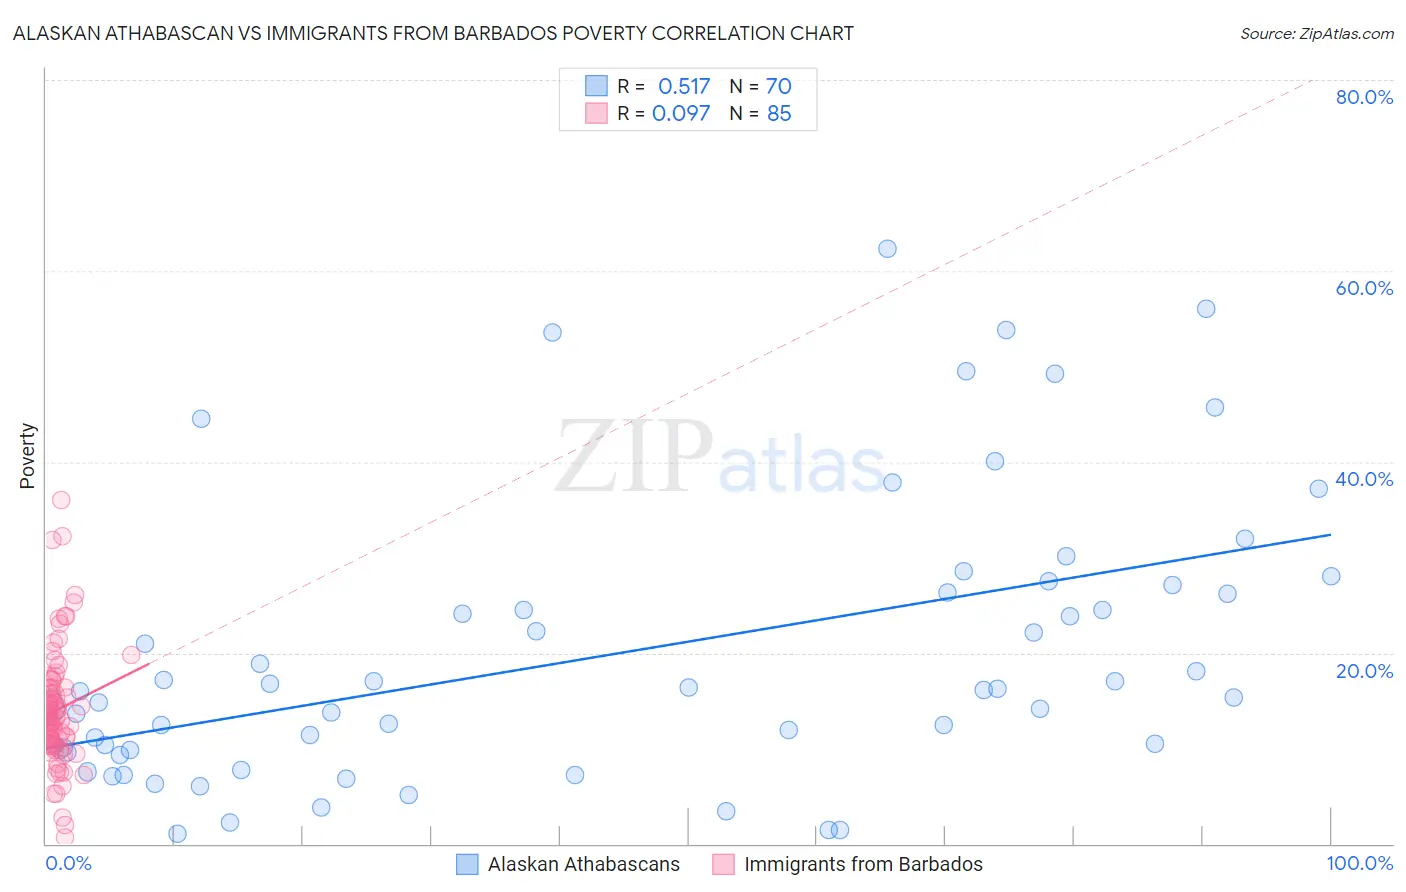
Alaskan Athabascan vs Immigrants from Barbados Poverty Correlation Chart

The statistical analysis conducted on geographies consisting of 45,813,239 people shows a substantial positive correlation between the proportion of Alaskan Athabascans and poverty level in the United States with a correlation coefficient (R) of 0.517 and weighted average of 13.6%. Similarly, the statistical analysis conducted on geographies consisting of 112,771,584 people shows a slight positive correlation between the proportion of Immigrants from Barbados and poverty level in the United States with a correlation coefficient (R) of 0.097 and weighted average of 14.9%, a difference of 9.8%.
Alaskan Athabascan vs Immigrants from Barbados Poverty

Poverty Correlation Summary

MeasurementAlaskan AthabascanImmigrants from Barbados
Minimum1.1%0.68%
Maximum62.3%36.1%
Range61.2%35.4%
Mean19.9%14.0%
Median16.0%13.2%
Interquartile 25% (IQ1)9.8%10.4%
Interquartile 75% (IQ3)26.3%16.4%
Interquartile Range (IQR)16.5%6.0%
Standard Deviation (Sample)14.7%6.2%
Standard Deviation (Population)14.6%6.2%

Similar Demographics by Poverty

Demographics Similar to Alaskan Athabascans by Poverty

In terms of poverty, the demographic groups most similar to Alaskan Athabascans are Osage (13.6%, a difference of 0.060%), Nigerian (13.6%, a difference of 0.17%), Immigrants from Nigeria (13.5%, a difference of 0.30%), Alaska Native (13.5%, a difference of 0.75%), and Marshallese (13.4%, a difference of 0.90%).
DemographicsRating | RankPoverty
Immigrants | Africa
2.5
/100
|
#223
Tragic
13.4%
Immigrants | Eritrea
2.4
/100
|
#224
Tragic
13.4%
German Russians
2.2
/100
|
#225
Tragic
13.4%
Marshallese
2.2
/100
|
#226
Tragic
13.4%
Alaska Natives
2.1
/100
|
#227
Tragic
13.5%
Immigrants | Nigeria
1.7
/100
|
#228
Tragic
13.5%
Osage
1.5
/100
|
#229
Tragic
13.6%
Alaskan Athabascans
1.5
/100
|
#230
Tragic
13.6%
Nigerians
1.4
/100
|
#231
Tragic
13.6%
Fijians
0.8
/100
|
#232
Tragic
13.7%
Immigrants | Saudi Arabia
0.8
/100
|
#233
Tragic
13.8%
Immigrants | Laos
0.7
/100
|
#234
Tragic
13.8%
Cubans
0.6
/100
|
#235
Tragic
13.9%
Immigrants | Armenia
0.5
/100
|
#236
Tragic
13.9%
French American Indians
0.5
/100
|
#237
Tragic
13.9%

Demographics Similar to Immigrants from Barbados by Poverty

In terms of poverty, the demographic groups most similar to Immigrants from Barbados are Haitian (14.9%, a difference of 0.070%), Immigrants from St. Vincent and the Grenadines (14.9%, a difference of 0.27%), Comanche (15.0%, a difference of 0.33%), Immigrants from Haiti (15.0%, a difference of 0.45%), and West Indian (15.0%, a difference of 0.55%).
DemographicsRating | RankPoverty
Barbadians
0.0
/100
|
#274
Tragic
14.8%
Immigrants | West Indies
0.0
/100
|
#275
Tragic
14.8%
Immigrants | Bahamas
0.0
/100
|
#276
Tragic
14.8%
Bangladeshis
0.0
/100
|
#277
Tragic
14.8%
Belizeans
0.0
/100
|
#278
Tragic
14.8%
Immigrants | St. Vincent and the Grenadines
0.0
/100
|
#279
Tragic
14.9%
Haitians
0.0
/100
|
#280
Tragic
14.9%
Immigrants | Barbados
0.0
/100
|
#281
Tragic
14.9%
Comanche
0.0
/100
|
#282
Tragic
15.0%
Immigrants | Haiti
0.0
/100
|
#283
Tragic
15.0%
West Indians
0.0
/100
|
#284
Tragic
15.0%
Vietnamese
0.0
/100
|
#285
Tragic
15.0%
Immigrants | Latin America
0.0
/100
|
#286
Tragic
15.0%
Inupiat
0.0
/100
|
#287
Tragic
15.1%
Yaqui
0.0
/100
|
#288
Tragic
15.1%