Alaskan Athabascan vs European Child Poverty Among Boys Under 16

COMPARE

Alaskan Athabascan
Race
Ancestry
AfghanAfricanAlaska NativeAlaskan AthabascanAlbanianAleutAlsatianAmericanApacheArabArapahoArgentineanArmenianAssyrian/Chaldean/SyriacAustralianAustrianBahamianBangladeshiBarbadianBasqueBelgianBelizeanBermudanBhutaneseBlackfeetBolivianBrazilianBritishBritish West IndianBulgarianBurmeseCajunCambodianCanadianCape VerdeanCarpatho RusynCelticCentral AmericanCentral American IndianCherokeeCheyenneChickasawChileanChineseChippewaChoctawColombianColvilleComancheCosta RicanCreeCreekCroatianCrowCubanCypriotCzechCzechoslovakianDanishDelawareDominicanDutchDutch West IndianEastern EuropeanEcuadorianEgyptianEnglishEstonianEthiopianFijianFilipinoFinnishFrenchFrench American IndianFrench CanadianGermanGerman RussianGhanaianGreekGuamanian/ChamorroGuatemalanGuyaneseHaitianHmongHonduranHopiHoumaHungarianIcelanderIndian (Asian)IndonesianInupiatIranianIraqiIrishIroquoisIsraeliItalianJamaicanJapaneseJordanianKenyanKiowaKoreanLaotianLatvianLebaneseLiberianLithuanianLumbeeLuxembourgerMacedonianMalaysianMalteseMarshalleseMenomineeMexicanMexican American IndianMongolianMoroccanNative HawaiianNavajoNepaleseNew ZealanderNicaraguanNigerianNorthern EuropeanNorwegianOkinawanOsageOttawaPaiutePakistaniPalestinianPanamanianParaguayanPennsylvania GermanPeruvianPimaPolishPortuguesePotawatomiPuebloPuerto RicanPuget Sound SalishRomanianRussianSalvadoranSamoanScandinavianScotch-IrishScottishSeminoleSenegaleseSerbianShoshoneSierra LeoneanSiouxSlavicSlovakSloveneSomaliSouth AfricanSouth AmericanSouth American IndianSoviet UnionSpaniardSpanishSpanish AmericanSpanish American IndianSri LankanSubsaharan AfricanSudaneseSwedishSwissSyrianTaiwaneseThaiTlingit-HaidaTohono O'OdhamTonganTrinidadian and TobagonianTsimshianTurkishU.S. Virgin IslanderUgandanUkrainianUruguayanUteVenezuelanVietnameseWelshWest IndianYakamaYaquiYugoslavianYumanYup'ikZimbabwean
Immigration
NonimmigrantsImmigrantsAfghanistanAfricaAlbaniaArgentinaArmeniaAsiaAustraliaAustriaBahamasBangladeshBarbadosBelarusBelgiumBelizeBoliviaBosnia and HerzegovinaBrazilBulgariaBurma/MyanmarCabo VerdeCambodiaCameroonCanadaCaribbeanCentral AmericaChileChinaColombiaCongoCosta RicaCroatiaCubaCzechoslovakiaDenmarkDominicaDominican RepublicEastern AfricaEastern AsiaEastern EuropeEcuadorEgyptEl SalvadorEnglandEritreaEthiopiaEuropeFijiFranceGermanyGhanaGreeceGrenadaGuatemalaGuyanaHaitiHondurasHong KongHungaryIndiaIndonesiaIranIraqIrelandIsraelItalyJamaicaJapanJordanKazakhstanKenyaKoreaKuwaitLaosLatin AmericaLatviaLebanonLiberiaLithuaniaMalaysiaMexicoMicronesiaMiddle AfricaMoldovaMoroccoNepalNetherlandsNicaraguaNigeriaNorth AmericaNorth MacedoniaNorthern AfricaNorthern EuropeNorwayOceaniaPakistanPanamaPeruPhilippinesPolandPortugalRomaniaRussiaSaudi ArabiaScotlandSenegalSerbiaSierra LeoneSingaporeSomaliaSouth AfricaSouth AmericaSouth Central AsiaSouth Eastern AsiaSouthern EuropeSpainSri LankaSt. Vincent and the GrenadinesSudanSwedenSwitzerlandSyriaTaiwanThailandTrinidad and TobagoTurkeyUgandaUkraineUruguayUzbekistanVenezuelaVietnamWest IndiesWestern AfricaWestern AsiaWestern EuropeYemenZaireZimbabweAzores
European
Race
Ancestry
AfghanAfricanAlaska NativeAlbanianAleutAlsatianAmericanApacheArabArapahoArgentineanArmenianAssyrian/Chaldean/SyriacAustralianAustrianBahamianBangladeshiBarbadianBasqueBelgianBelizeanBermudanBhutaneseBlackfeetBolivianBrazilianBritishBritish West IndianBulgarianBurmeseCajunCambodianCanadianCape VerdeanCarpatho RusynCelticCentral AmericanCentral American IndianCherokeeCheyenneChickasawChileanChineseChippewaChoctawColombianColvilleComancheCosta RicanCreeCreekCroatianCrowCubanCypriotCzechCzechoslovakianDanishDelawareDominicanDutchDutch West IndianEastern EuropeanEcuadorianEgyptianEnglishEstonianEthiopianEuropeanFijianFilipinoFinnishFrenchFrench American IndianFrench CanadianGermanGerman RussianGhanaianGreekGuamanian/ChamorroGuatemalanGuyaneseHaitianHmongHonduranHopiHoumaHungarianIcelanderIndian (Asian)IndonesianInupiatIranianIraqiIrishIroquoisIsraeliItalianJamaicanJapaneseJordanianKenyanKiowaKoreanLaotianLatvianLebaneseLiberianLithuanianLumbeeLuxembourgerMacedonianMalaysianMalteseMarshalleseMenomineeMexicanMexican American IndianMongolianMoroccanNative HawaiianNavajoNepaleseNew ZealanderNicaraguanNigerianNorthern EuropeanNorwegianOkinawanOsageOttawaPaiutePakistaniPalestinianPanamanianParaguayanPennsylvania GermanPeruvianPimaPolishPortuguesePotawatomiPuebloPuerto RicanPuget Sound SalishRomanianRussianSalvadoranSamoanScandinavianScotch-IrishScottishSeminoleSenegaleseSerbianShoshoneSierra LeoneanSiouxSlavicSlovakSloveneSomaliSouth AfricanSouth AmericanSouth American IndianSoviet UnionSpaniardSpanishSpanish AmericanSpanish American IndianSri LankanSubsaharan AfricanSudaneseSwedishSwissSyrianTaiwaneseThaiTlingit-HaidaTohono O'OdhamTonganTrinidadian and TobagonianTsimshianTurkishU.S. Virgin IslanderUgandanUkrainianUruguayanUteVenezuelanVietnameseWelshWest IndianYakamaYaquiYugoslavianYumanYup'ikZimbabwean
Immigration
NonimmigrantsImmigrantsAfghanistanAfricaAlbaniaArgentinaArmeniaAsiaAustraliaAustriaBahamasBangladeshBarbadosBelarusBelgiumBelizeBoliviaBosnia and HerzegovinaBrazilBulgariaBurma/MyanmarCabo VerdeCambodiaCameroonCanadaCaribbeanCentral AmericaChileChinaColombiaCongoCosta RicaCroatiaCubaCzechoslovakiaDenmarkDominicaDominican RepublicEastern AfricaEastern AsiaEastern EuropeEcuadorEgyptEl SalvadorEnglandEritreaEthiopiaEuropeFijiFranceGermanyGhanaGreeceGrenadaGuatemalaGuyanaHaitiHondurasHong KongHungaryIndiaIndonesiaIranIraqIrelandIsraelItalyJamaicaJapanJordanKazakhstanKenyaKoreaKuwaitLaosLatin AmericaLatviaLebanonLiberiaLithuaniaMalaysiaMexicoMicronesiaMiddle AfricaMoldovaMoroccoNepalNetherlandsNicaraguaNigeriaNorth AmericaNorth MacedoniaNorthern AfricaNorthern EuropeNorwayOceaniaPakistanPanamaPeruPhilippinesPolandPortugalRomaniaRussiaSaudi ArabiaScotlandSenegalSerbiaSierra LeoneSingaporeSomaliaSouth AfricaSouth AmericaSouth Central AsiaSouth Eastern AsiaSouthern EuropeSpainSri LankaSt. Vincent and the GrenadinesSudanSwedenSwitzerlandSyriaTaiwanThailandTrinidad and TobagoTurkeyUgandaUkraineUruguayUzbekistanVenezuelaVietnamWest IndiesWestern AfricaWestern AsiaWestern EuropeYemenZaireZimbabweAzores
Child Poverty Among Boys Under 16
Income
Poverty
Unemployment
Labor Participation
Family Structure
Vehicle Availability
Education Level
Disability

Child Poverty Among Boys Under 16 Comparison

Alaskan Athabascans

Europeans

Tragic
Exceptional
17.6%
CHILD POVERTY AMONG BOYS UNDER 16
7.3/ 100
METRIC RATING
209th/ 347
METRIC RANK
14.5%
CHILD POVERTY AMONG BOYS UNDER 16
98.4/ 100
METRIC RATING
70th/ 347
METRIC RANK

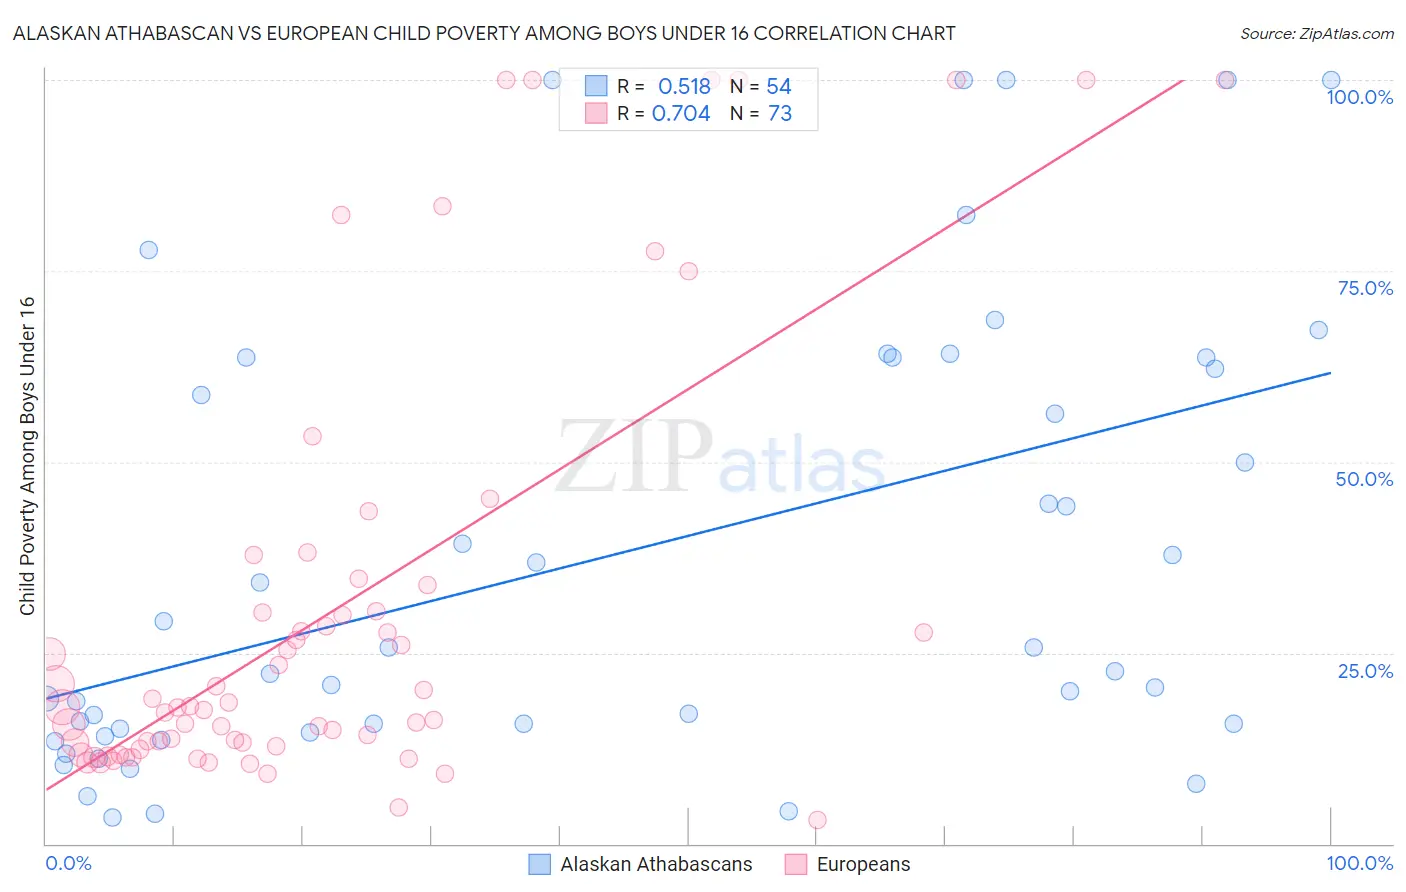
Alaskan Athabascan vs European Child Poverty Among Boys Under 16 Correlation Chart

The statistical analysis conducted on geographies consisting of 45,576,006 people shows a substantial positive correlation between the proportion of Alaskan Athabascans and poverty level among boys under the age of 16 in the United States with a correlation coefficient (R) of 0.518 and weighted average of 17.6%. Similarly, the statistical analysis conducted on geographies consisting of 542,678,765 people shows a strong positive correlation between the proportion of Europeans and poverty level among boys under the age of 16 in the United States with a correlation coefficient (R) of 0.704 and weighted average of 14.5%, a difference of 21.0%.
Alaskan Athabascan vs European Child Poverty Among Boys Under 16

Child Poverty Among Boys Under 16 Correlation Summary

MeasurementAlaskan AthabascanEuropean
Minimum3.4%3.1%
Maximum100.0%100.0%
Range96.6%96.9%
Mean37.8%30.4%
Median24.1%17.9%
Interquartile 25% (IQ1)15.0%12.5%
Interquartile 75% (IQ3)63.6%32.2%
Interquartile Range (IQR)48.6%19.6%
Standard Deviation (Sample)29.5%28.3%
Standard Deviation (Population)29.2%28.1%

Similar Demographics by Child Poverty Among Boys Under 16

Demographics Similar to Alaskan Athabascans by Child Poverty Among Boys Under 16

In terms of child poverty among boys under 16, the demographic groups most similar to Alaskan Athabascans are Malaysian (17.6%, a difference of 0.11%), Immigrants from Armenia (17.6%, a difference of 0.18%), Immigrants (17.6%, a difference of 0.24%), Aleut (17.7%, a difference of 0.29%), and Immigrants from Thailand (17.5%, a difference of 0.32%).
DemographicsRating | RankChild Poverty Among Boys Under 16
Immigrants | Sierra Leone
13.4
/100
|
#202
Poor
17.3%
Immigrants | Uzbekistan
13.3
/100
|
#203
Poor
17.3%
Ugandans
12.5
/100
|
#204
Poor
17.3%
Immigrants | Portugal
11.2
/100
|
#205
Poor
17.4%
German Russians
10.9
/100
|
#206
Poor
17.4%
Immigrants | Thailand
8.2
/100
|
#207
Tragic
17.5%
Malaysians
7.6
/100
|
#208
Tragic
17.6%
Alaskan Athabascans
7.3
/100
|
#209
Tragic
17.6%
Immigrants | Armenia
6.8
/100
|
#210
Tragic
17.6%
Immigrants | Immigrants
6.7
/100
|
#211
Tragic
17.6%
Aleuts
6.6
/100
|
#212
Tragic
17.7%
Immigrants | Eastern Africa
6.0
/100
|
#213
Tragic
17.7%
Panamanians
5.9
/100
|
#214
Tragic
17.7%
Osage
5.8
/100
|
#215
Tragic
17.7%
Moroccans
5.6
/100
|
#216
Tragic
17.7%

Demographics Similar to Europeans by Child Poverty Among Boys Under 16

In terms of child poverty among boys under 16, the demographic groups most similar to Europeans are Immigrants from Austria (14.5%, a difference of 0.0%), Slovene (14.5%, a difference of 0.040%), Immigrants from Europe (14.5%, a difference of 0.13%), Immigrants from Bulgaria (14.5%, a difference of 0.15%), and Soviet Union (14.5%, a difference of 0.16%).
DemographicsRating | RankChild Poverty Among Boys Under 16
Cambodians
98.5
/100
|
#63
Exceptional
14.5%
Immigrants | Romania
98.5
/100
|
#64
Exceptional
14.5%
Soviet Union
98.5
/100
|
#65
Exceptional
14.5%
Immigrants | Bulgaria
98.5
/100
|
#66
Exceptional
14.5%
Immigrants | Europe
98.4
/100
|
#67
Exceptional
14.5%
Slovenes
98.4
/100
|
#68
Exceptional
14.5%
Immigrants | Austria
98.4
/100
|
#69
Exceptional
14.5%
Europeans
98.4
/100
|
#70
Exceptional
14.5%
Immigrants | Netherlands
98.1
/100
|
#71
Exceptional
14.6%
Immigrants | Latvia
98.1
/100
|
#72
Exceptional
14.6%
Immigrants | Turkey
98.0
/100
|
#73
Exceptional
14.6%
Australians
98.0
/100
|
#74
Exceptional
14.7%
Immigrants | Poland
97.9
/100
|
#75
Exceptional
14.7%
Immigrants | Croatia
97.9
/100
|
#76
Exceptional
14.7%
Macedonians
97.9
/100
|
#77
Exceptional
14.7%