Alaska Native vs Immigrants from Norway Seniors Poverty Over the Age of 65

COMPARE

Alaska Native
Race
Ancestry
AfghanAfricanAlaska NativeAlaskan AthabascanAlbanianAleutAlsatianAmericanApacheArabArapahoArgentineanArmenianAssyrian/Chaldean/SyriacAustralianAustrianBahamianBangladeshiBarbadianBasqueBelgianBelizeanBermudanBhutaneseBlackfeetBolivianBrazilianBritishBritish West IndianBulgarianBurmeseCajunCambodianCanadianCape VerdeanCarpatho RusynCelticCentral AmericanCentral American IndianCherokeeCheyenneChickasawChileanChineseChippewaChoctawColombianColvilleComancheCosta RicanCreeCreekCroatianCrowCubanCypriotCzechCzechoslovakianDanishDelawareDominicanDutchDutch West IndianEastern EuropeanEcuadorianEgyptianEnglishEstonianEthiopianEuropeanFijianFilipinoFinnishFrenchFrench American IndianFrench CanadianGermanGerman RussianGhanaianGreekGuamanian/ChamorroGuatemalanGuyaneseHaitianHmongHonduranHopiHoumaHungarianIcelanderIndian (Asian)IndonesianInupiatIranianIraqiIrishIroquoisIsraeliItalianJamaicanJapaneseJordanianKenyanKiowaKoreanLaotianLatvianLebaneseLiberianLithuanianLumbeeLuxembourgerMacedonianMalaysianMalteseMarshalleseMenomineeMexicanMexican American IndianMongolianMoroccanNative HawaiianNavajoNepaleseNew ZealanderNicaraguanNigerianNorthern EuropeanNorwegianOkinawanOsageOttawaPaiutePakistaniPalestinianPanamanianParaguayanPennsylvania GermanPeruvianPimaPolishPortuguesePotawatomiPuebloPuerto RicanPuget Sound SalishRomanianRussianSalvadoranSamoanScandinavianScotch-IrishScottishSeminoleSenegaleseSerbianShoshoneSierra LeoneanSiouxSlavicSlovakSloveneSomaliSouth AfricanSouth AmericanSouth American IndianSoviet UnionSpaniardSpanishSpanish AmericanSpanish American IndianSri LankanSubsaharan AfricanSudaneseSwedishSwissSyrianTaiwaneseThaiTlingit-HaidaTohono O'OdhamTonganTrinidadian and TobagonianTsimshianTurkishU.S. Virgin IslanderUgandanUkrainianUruguayanUteVenezuelanVietnameseWelshWest IndianYakamaYaquiYugoslavianYumanYup'ikZimbabwean
Immigration
NonimmigrantsImmigrantsAfghanistanAfricaAlbaniaArgentinaArmeniaAsiaAustraliaAustriaBahamasBangladeshBarbadosBelarusBelgiumBelizeBoliviaBosnia and HerzegovinaBrazilBulgariaBurma/MyanmarCabo VerdeCambodiaCameroonCanadaCaribbeanCentral AmericaChileChinaColombiaCongoCosta RicaCroatiaCubaCzechoslovakiaDenmarkDominicaDominican RepublicEastern AfricaEastern AsiaEastern EuropeEcuadorEgyptEl SalvadorEnglandEritreaEthiopiaEuropeFijiFranceGermanyGhanaGreeceGrenadaGuatemalaGuyanaHaitiHondurasHong KongHungaryIndiaIndonesiaIranIraqIrelandIsraelItalyJamaicaJapanJordanKazakhstanKenyaKoreaKuwaitLaosLatin AmericaLatviaLebanonLiberiaLithuaniaMalaysiaMexicoMicronesiaMiddle AfricaMoldovaMoroccoNepalNetherlandsNicaraguaNigeriaNorth AmericaNorth MacedoniaNorthern AfricaNorthern EuropeOceaniaPakistanPanamaPeruPhilippinesPolandPortugalRomaniaRussiaSaudi ArabiaScotlandSenegalSerbiaSierra LeoneSingaporeSomaliaSouth AfricaSouth AmericaSouth Central AsiaSouth Eastern AsiaSouthern EuropeSpainSri LankaSt. Vincent and the GrenadinesSudanSwedenSwitzerlandSyriaTaiwanThailandTrinidad and TobagoTurkeyUgandaUkraineUruguayUzbekistanVenezuelaVietnamWest IndiesWestern AfricaWestern AsiaWestern EuropeYemenZaireZimbabweAzores
Immigrants from Norway
Race
Ancestry
AfghanAfricanAlaskan AthabascanAlbanianAleutAlsatianAmericanApacheArabArapahoArgentineanArmenianAssyrian/Chaldean/SyriacAustralianAustrianBahamianBangladeshiBarbadianBasqueBelgianBelizeanBermudanBhutaneseBlackfeetBolivianBrazilianBritishBritish West IndianBulgarianBurmeseCajunCambodianCanadianCape VerdeanCarpatho RusynCelticCentral AmericanCentral American IndianCherokeeCheyenneChickasawChileanChineseChippewaChoctawColombianColvilleComancheCosta RicanCreeCreekCroatianCrowCubanCypriotCzechCzechoslovakianDanishDelawareDominicanDutchDutch West IndianEastern EuropeanEcuadorianEgyptianEnglishEstonianEthiopianEuropeanFijianFilipinoFinnishFrenchFrench American IndianFrench CanadianGermanGerman RussianGhanaianGreekGuamanian/ChamorroGuatemalanGuyaneseHaitianHmongHonduranHopiHoumaHungarianIcelanderIndian (Asian)IndonesianInupiatIranianIraqiIrishIroquoisIsraeliItalianJamaicanJapaneseJordanianKenyanKiowaKoreanLaotianLatvianLebaneseLiberianLithuanianLumbeeLuxembourgerMacedonianMalaysianMalteseMarshalleseMenomineeMexicanMexican American IndianMongolianMoroccanNative HawaiianNavajoNepaleseNew ZealanderNicaraguanNigerianNorthern EuropeanNorwegianOkinawanOsageOttawaPaiutePakistaniPalestinianPanamanianParaguayanPennsylvania GermanPeruvianPimaPolishPortuguesePotawatomiPuebloPuerto RicanPuget Sound SalishRomanianRussianSalvadoranSamoanScandinavianScotch-IrishScottishSeminoleSenegaleseSerbianShoshoneSierra LeoneanSiouxSlavicSlovakSloveneSomaliSouth AfricanSouth AmericanSouth American IndianSoviet UnionSpaniardSpanishSpanish AmericanSpanish American IndianSri LankanSubsaharan AfricanSudaneseSwedishSwissSyrianTaiwaneseThaiTlingit-HaidaTohono O'OdhamTonganTrinidadian and TobagonianTsimshianTurkishU.S. Virgin IslanderUgandanUkrainianUruguayanUteVenezuelanVietnameseWelshWest IndianYakamaYaquiYugoslavianYumanYup'ikZimbabwean
Immigration
NonimmigrantsImmigrantsAfghanistanAfricaAlbaniaArgentinaArmeniaAsiaAustraliaAustriaBahamasBangladeshBarbadosBelarusBelgiumBelizeBoliviaBosnia and HerzegovinaBrazilBulgariaBurma/MyanmarCabo VerdeCambodiaCameroonCanadaCaribbeanCentral AmericaChileChinaColombiaCongoCosta RicaCroatiaCubaCzechoslovakiaDenmarkDominicaDominican RepublicEastern AfricaEastern AsiaEastern EuropeEcuadorEgyptEl SalvadorEnglandEritreaEthiopiaEuropeFijiFranceGermanyGhanaGreeceGrenadaGuatemalaGuyanaHaitiHondurasHong KongHungaryIndiaIndonesiaIranIraqIrelandIsraelItalyJamaicaJapanJordanKazakhstanKenyaKoreaKuwaitLaosLatin AmericaLatviaLebanonLiberiaLithuaniaMalaysiaMexicoMicronesiaMiddle AfricaMoldovaMoroccoNepalNetherlandsNicaraguaNigeriaNorth AmericaNorth MacedoniaNorthern AfricaNorthern EuropeNorwayOceaniaPakistanPanamaPeruPhilippinesPolandPortugalRomaniaRussiaSaudi ArabiaScotlandSenegalSerbiaSierra LeoneSingaporeSomaliaSouth AfricaSouth AmericaSouth Central AsiaSouth Eastern AsiaSouthern EuropeSpainSri LankaSt. Vincent and the GrenadinesSudanSwedenSwitzerlandSyriaTaiwanThailandTrinidad and TobagoTurkeyUgandaUkraineUruguayUzbekistanVenezuelaVietnamWest IndiesWestern AfricaWestern AsiaWestern EuropeYemenZaireZimbabweAzores
Seniors Poverty Over the Age of 65
Income
Poverty
Unemployment
Labor Participation
Family Structure
Vehicle Availability
Education Level
Disability

Seniors Poverty Over the Age of 65 Comparison

Alaska Natives

Immigrants from Norway

Good
Excellent
10.8%
SENIORS POVERTY OVER THE AGE OF 65
60.3/ 100
METRIC RATING
167th/ 347
METRIC RANK
10.5%
SENIORS POVERTY OVER THE AGE OF 65
86.5/ 100
METRIC RATING
135th/ 347
METRIC RANK

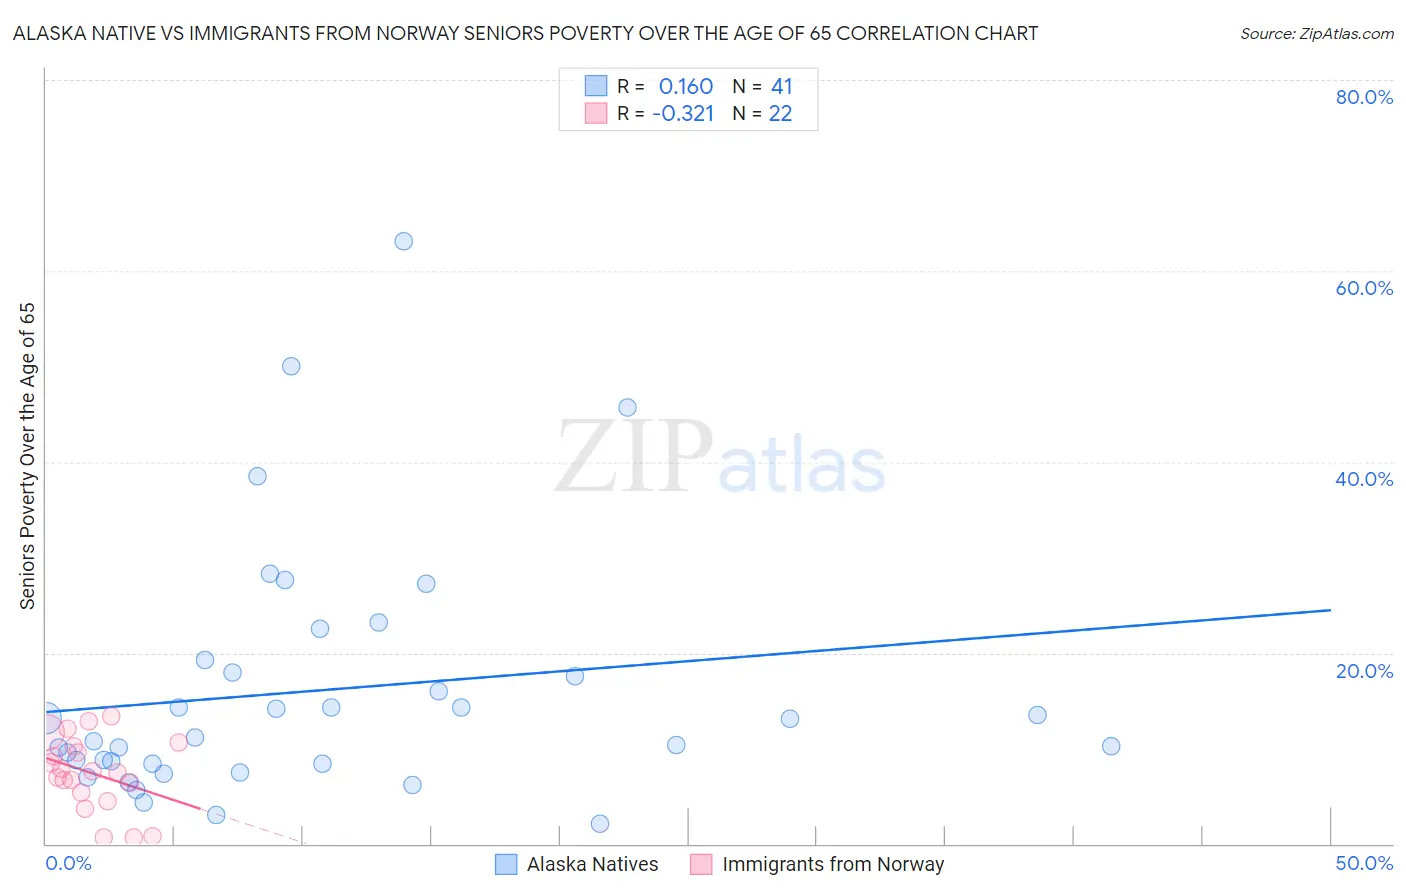
Alaska Native vs Immigrants from Norway Seniors Poverty Over the Age of 65 Correlation Chart

The statistical analysis conducted on geographies consisting of 76,614,353 people shows a poor positive correlation between the proportion of Alaska Natives and poverty level among seniors over the age of 65 in the United States with a correlation coefficient (R) of 0.160 and weighted average of 10.8%. Similarly, the statistical analysis conducted on geographies consisting of 116,590,861 people shows a mild negative correlation between the proportion of Immigrants from Norway and poverty level among seniors over the age of 65 in the United States with a correlation coefficient (R) of -0.321 and weighted average of 10.5%, a difference of 3.3%.
Alaska Native vs Immigrants from Norway Seniors Poverty Over the Age of 65

Seniors Poverty Over the Age of 65 Correlation Summary

MeasurementAlaska NativeImmigrants from Norway
Minimum2.0%0.71%
Maximum63.2%13.4%
Range61.1%12.7%
Mean16.1%7.4%
Median11.1%7.5%
Interquartile 25% (IQ1)8.4%5.4%
Interquartile 75% (IQ3)18.6%10.2%
Interquartile Range (IQR)10.2%4.9%
Standard Deviation (Sample)13.1%3.8%
Standard Deviation (Population)12.9%3.7%

Similar Demographics by Seniors Poverty Over the Age of 65

Demographics Similar to Alaska Natives by Seniors Poverty Over the Age of 65

In terms of seniors poverty over the age of 65, the demographic groups most similar to Alaska Natives are Malaysian (10.8%, a difference of 0.16%), Immigrants from South Eastern Asia (10.8%, a difference of 0.17%), Potawatomi (10.8%, a difference of 0.22%), Mongolian (10.9%, a difference of 0.22%), and Sri Lankan (10.9%, a difference of 0.32%).
DemographicsRating | RankSeniors Poverty Over the Age of 65
Sudanese
68.2
/100
|
#160
Good
10.7%
Arabs
65.2
/100
|
#161
Good
10.8%
Immigrants | Indonesia
64.8
/100
|
#162
Good
10.8%
Tsimshian
64.5
/100
|
#163
Good
10.8%
Potawatomi
62.6
/100
|
#164
Good
10.8%
Immigrants | South Eastern Asia
62.1
/100
|
#165
Good
10.8%
Malaysians
62.0
/100
|
#166
Good
10.8%
Alaska Natives
60.3
/100
|
#167
Good
10.8%
Mongolians
58.0
/100
|
#168
Average
10.9%
Sri Lankans
56.8
/100
|
#169
Average
10.9%
Immigrants | Eastern Europe
55.8
/100
|
#170
Average
10.9%
Immigrants | Nonimmigrants
55.1
/100
|
#171
Average
10.9%
Immigrants | Syria
54.7
/100
|
#172
Average
10.9%
Spaniards
50.7
/100
|
#173
Average
10.9%
Immigrants | Sudan
50.0
/100
|
#174
Average
10.9%

Demographics Similar to Immigrants from Norway by Seniors Poverty Over the Age of 65

In terms of seniors poverty over the age of 65, the demographic groups most similar to Immigrants from Norway are Immigrants from Serbia (10.5%, a difference of 0.010%), Sierra Leonean (10.5%, a difference of 0.060%), Guamanian/Chamorro (10.5%, a difference of 0.22%), Immigrants from Turkey (10.5%, a difference of 0.25%), and Egyptian (10.5%, a difference of 0.27%).
DemographicsRating | RankSeniors Poverty Over the Age of 65
Ottawa
88.5
/100
|
#128
Excellent
10.4%
Immigrants | Iran
88.4
/100
|
#129
Excellent
10.4%
Immigrants | Oceania
88.4
/100
|
#130
Excellent
10.4%
Egyptians
87.8
/100
|
#131
Excellent
10.5%
Immigrants | Turkey
87.7
/100
|
#132
Excellent
10.5%
Guamanians/Chamorros
87.5
/100
|
#133
Excellent
10.5%
Sierra Leoneans
86.8
/100
|
#134
Excellent
10.5%
Immigrants | Norway
86.5
/100
|
#135
Excellent
10.5%
Immigrants | Serbia
86.4
/100
|
#136
Excellent
10.5%
Immigrants | Australia
85.1
/100
|
#137
Excellent
10.5%
Immigrants | Latvia
84.7
/100
|
#138
Excellent
10.5%
Portuguese
84.1
/100
|
#139
Excellent
10.5%
Immigrants | Kenya
83.4
/100
|
#140
Excellent
10.5%
Immigrants | Europe
83.3
/100
|
#141
Excellent
10.5%
Osage
82.8
/100
|
#142
Excellent
10.6%