African vs Slavic Family Poverty
COMPARE
African
Slavic
Family Poverty
Family Poverty Comparison
Africans
Slavs
11.8%
FAMILY POVERTY
0.0/ 100
METRIC RATING
303rd/ 347
METRIC RANK
8.1%
FAMILY POVERTY
95.6/ 100
METRIC RATING
104th/ 347
METRIC RANK
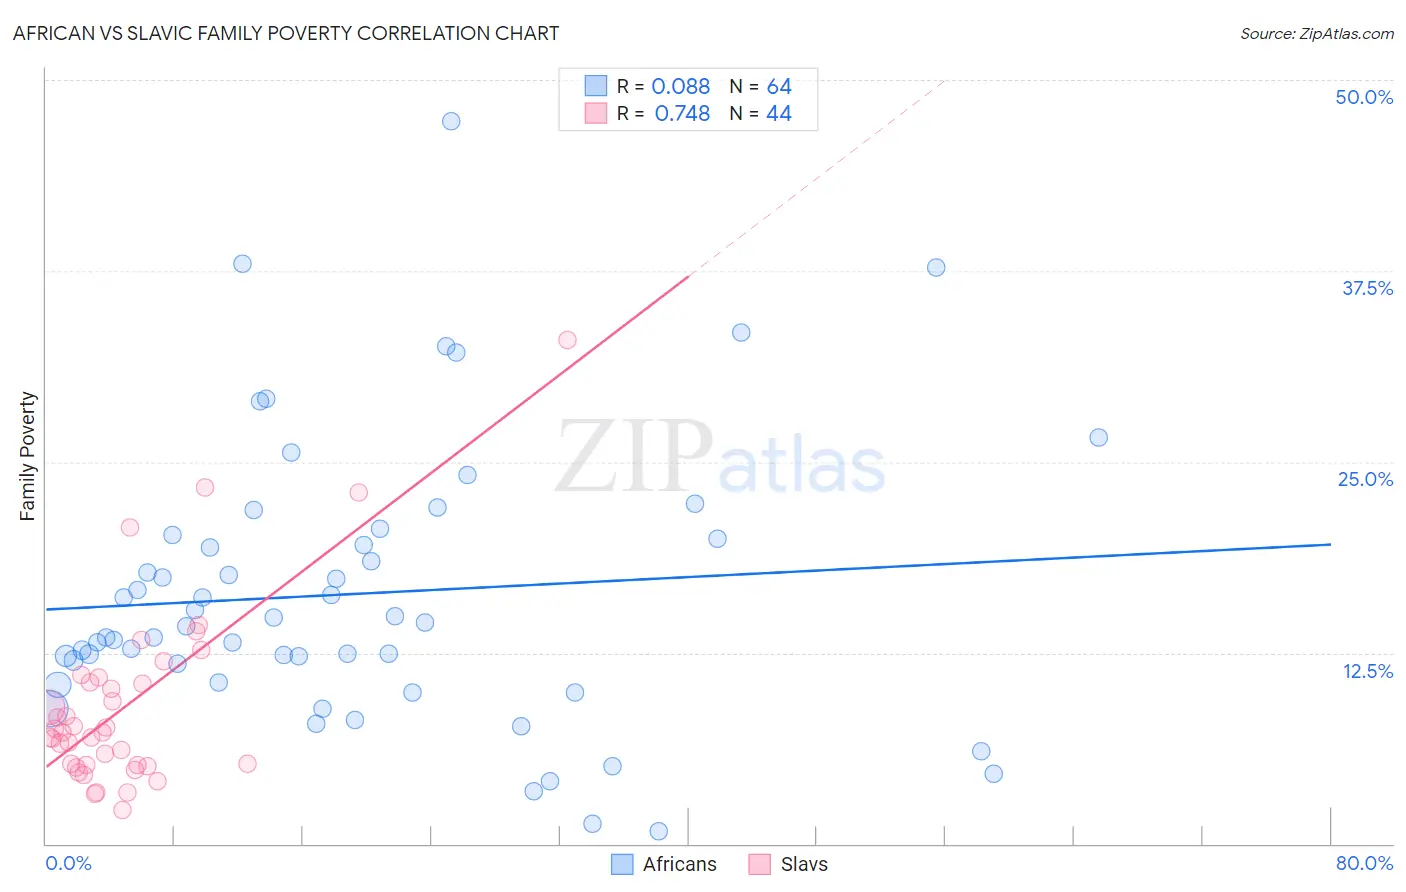
African vs Slavic Family Poverty Correlation Chart
The statistical analysis conducted on geographies consisting of 468,652,941 people shows a slight positive correlation between the proportion of Africans and poverty level among families in the United States with a correlation coefficient (R) of 0.088 and weighted average of 11.8%. Similarly, the statistical analysis conducted on geographies consisting of 270,374,378 people shows a strong positive correlation between the proportion of Slavs and poverty level among families in the United States with a correlation coefficient (R) of 0.748 and weighted average of 8.1%, a difference of 45.4%.
Family Poverty Correlation Summary
| Measurement | African | Slavic |
| Minimum | 0.78% | 2.2% |
| Maximum | 47.3% | 33.0% |
| Range | 46.5% | 30.8% |
| Mean | 16.4% | 9.1% |
| Median | 14.4% | 7.3% |
| Interquartile 25% (IQ1) | 11.2% | 5.2% |
| Interquartile 75% (IQ3) | 20.1% | 10.7% |
| Interquartile Range (IQR) | 9.0% | 5.5% |
| Standard Deviation (Sample) | 9.2% | 6.1% |
| Standard Deviation (Population) | 9.1% | 6.0% |
Similar Demographics by Family Poverty
Demographics Similar to Africans by Family Poverty
In terms of family poverty, the demographic groups most similar to Africans are Immigrants from Latin America (11.8%, a difference of 0.19%), Mexican (11.8%, a difference of 0.37%), Guatemalan (11.7%, a difference of 0.50%), Bahamian (11.7%, a difference of 0.54%), and Immigrants from Bangladesh (11.7%, a difference of 0.80%).
| Demographics | Rating | Rank | Family Poverty |
| Choctaw | 0.0 /100 | #296 | Tragic 11.6% |
| Creek | 0.0 /100 | #297 | Tragic 11.7% |
| Immigrants | Senegal | 0.0 /100 | #298 | Tragic 11.7% |
| Dutch West Indians | 0.0 /100 | #299 | Tragic 11.7% |
| Immigrants | Bangladesh | 0.0 /100 | #300 | Tragic 11.7% |
| Bahamians | 0.0 /100 | #301 | Tragic 11.7% |
| Guatemalans | 0.0 /100 | #302 | Tragic 11.7% |
| Africans | 0.0 /100 | #303 | Tragic 11.8% |
| Immigrants | Latin America | 0.0 /100 | #304 | Tragic 11.8% |
| Mexicans | 0.0 /100 | #305 | Tragic 11.8% |
| Cajuns | 0.0 /100 | #306 | Tragic 11.9% |
| Immigrants | Congo | 0.0 /100 | #307 | Tragic 11.9% |
| Seminole | 0.0 /100 | #308 | Tragic 11.9% |
| Hispanics or Latinos | 0.0 /100 | #309 | Tragic 12.0% |
| Immigrants | Guatemala | 0.0 /100 | #310 | Tragic 12.0% |
Demographics Similar to Slavs by Family Poverty
In terms of family poverty, the demographic groups most similar to Slavs are Immigrants from Eastern Europe (8.1%, a difference of 0.010%), Laotian (8.1%, a difference of 0.030%), Immigrants from Indonesia (8.1%, a difference of 0.10%), Immigrants from Norway (8.1%, a difference of 0.11%), and New Zealander (8.1%, a difference of 0.14%).
| Demographics | Rating | Rank | Family Poverty |
| Immigrants | Switzerland | 96.1 /100 | #97 | Exceptional 8.1% |
| Immigrants | South Africa | 95.9 /100 | #98 | Exceptional 8.1% |
| Welsh | 95.8 /100 | #99 | Exceptional 8.1% |
| New Zealanders | 95.8 /100 | #100 | Exceptional 8.1% |
| Immigrants | Norway | 95.7 /100 | #101 | Exceptional 8.1% |
| Immigrants | Indonesia | 95.7 /100 | #102 | Exceptional 8.1% |
| Immigrants | Eastern Europe | 95.6 /100 | #103 | Exceptional 8.1% |
| Slavs | 95.6 /100 | #104 | Exceptional 8.1% |
| Laotians | 95.6 /100 | #105 | Exceptional 8.1% |
| Egyptians | 95.1 /100 | #106 | Exceptional 8.1% |
| French Canadians | 95.0 /100 | #107 | Exceptional 8.1% |
| Basques | 94.9 /100 | #108 | Exceptional 8.1% |
| Jordanians | 94.8 /100 | #109 | Exceptional 8.2% |
| Romanians | 94.7 /100 | #110 | Exceptional 8.2% |
| Taiwanese | 94.6 /100 | #111 | Exceptional 8.2% |