Afghan vs Immigrants from Cameroon Child Poverty Among Boys Under 16
COMPARE
Afghan
Immigrants from Cameroon
Child Poverty Among Boys Under 16
Child Poverty Among Boys Under 16 Comparison
Afghans
Immigrants from Cameroon
16.3%
CHILD POVERTY AMONG BOYS UNDER 16
55.4/ 100
METRIC RATING
167th/ 347
METRIC RANK
17.1%
CHILD POVERTY AMONG BOYS UNDER 16
19.0/ 100
METRIC RATING
198th/ 347
METRIC RANK
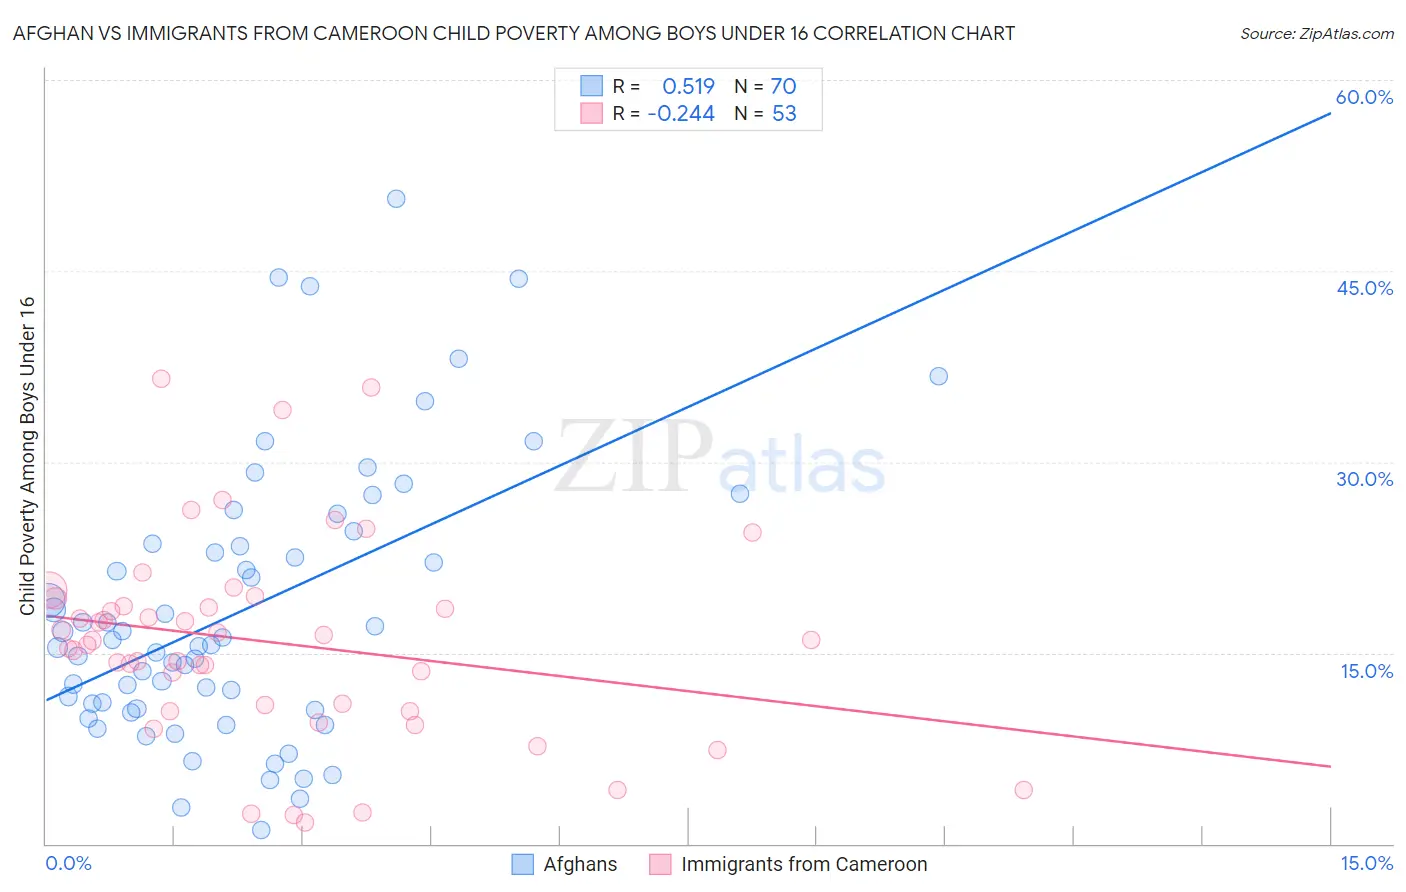
Afghan vs Immigrants from Cameroon Child Poverty Among Boys Under 16 Correlation Chart
The statistical analysis conducted on geographies consisting of 148,118,740 people shows a substantial positive correlation between the proportion of Afghans and poverty level among boys under the age of 16 in the United States with a correlation coefficient (R) of 0.519 and weighted average of 16.3%. Similarly, the statistical analysis conducted on geographies consisting of 130,269,448 people shows a weak negative correlation between the proportion of Immigrants from Cameroon and poverty level among boys under the age of 16 in the United States with a correlation coefficient (R) of -0.244 and weighted average of 17.1%, a difference of 4.7%.
Child Poverty Among Boys Under 16 Correlation Summary
| Measurement | Afghan | Immigrants from Cameroon |
| Minimum | 1.1% | 1.7% |
| Maximum | 50.7% | 36.5% |
| Range | 49.6% | 34.8% |
| Mean | 18.3% | 15.8% |
| Median | 15.8% | 16.0% |
| Interquartile 25% (IQ1) | 10.6% | 10.7% |
| Interquartile 75% (IQ3) | 23.6% | 19.0% |
| Interquartile Range (IQR) | 13.0% | 8.3% |
| Standard Deviation (Sample) | 10.8% | 7.8% |
| Standard Deviation (Population) | 10.7% | 7.8% |
Similar Demographics by Child Poverty Among Boys Under 16
Demographics Similar to Afghans by Child Poverty Among Boys Under 16
In terms of child poverty among boys under 16, the demographic groups most similar to Afghans are South American (16.3%, a difference of 0.010%), Immigrants from Saudi Arabia (16.4%, a difference of 0.20%), Immigrants from Bosnia and Herzegovina (16.4%, a difference of 0.41%), Immigrants from Ethiopia (16.4%, a difference of 0.46%), and Immigrants from Colombia (16.4%, a difference of 0.52%).
| Demographics | Rating | Rank | Child Poverty Among Boys Under 16 |
| Immigrants | Northern Africa | 71.3 /100 | #160 | Good 16.0% |
| Immigrants | Oceania | 71.3 /100 | #161 | Good 16.0% |
| Guamanians/Chamorros | 69.6 /100 | #162 | Good 16.1% |
| Costa Ricans | 68.1 /100 | #163 | Good 16.1% |
| Immigrants | Albania | 67.9 /100 | #164 | Good 16.1% |
| Colombians | 65.2 /100 | #165 | Good 16.1% |
| Immigrants | Germany | 63.6 /100 | #166 | Good 16.2% |
| Afghans | 55.4 /100 | #167 | Average 16.3% |
| South Americans | 55.3 /100 | #168 | Average 16.3% |
| Immigrants | Saudi Arabia | 53.6 /100 | #169 | Average 16.4% |
| Immigrants | Bosnia and Herzegovina | 51.7 /100 | #170 | Average 16.4% |
| Immigrants | Ethiopia | 51.3 /100 | #171 | Average 16.4% |
| Immigrants | Colombia | 50.8 /100 | #172 | Average 16.4% |
| Tsimshian | 50.5 /100 | #173 | Average 16.4% |
| Uruguayans | 50.0 /100 | #174 | Average 16.4% |
Demographics Similar to Immigrants from Cameroon by Child Poverty Among Boys Under 16
In terms of child poverty among boys under 16, the demographic groups most similar to Immigrants from Cameroon are Delaware (17.1%, a difference of 0.040%), Immigrants from Kenya (17.1%, a difference of 0.19%), Spaniard (17.1%, a difference of 0.25%), Spanish (17.0%, a difference of 0.30%), and Immigrants from Lebanon (17.0%, a difference of 0.37%).
| Demographics | Rating | Rank | Child Poverty Among Boys Under 16 |
| Alaska Natives | 29.8 /100 | #191 | Fair 16.8% |
| Immigrants | Uganda | 21.6 /100 | #192 | Fair 17.0% |
| Immigrants | Iraq | 21.6 /100 | #193 | Fair 17.0% |
| Immigrants | Lebanon | 21.2 /100 | #194 | Fair 17.0% |
| Spanish | 20.8 /100 | #195 | Fair 17.0% |
| Spaniards | 20.5 /100 | #196 | Fair 17.1% |
| Immigrants | Kenya | 20.1 /100 | #197 | Fair 17.1% |
| Immigrants | Cameroon | 19.0 /100 | #198 | Poor 17.1% |
| Delaware | 18.8 /100 | #199 | Poor 17.1% |
| Immigrants | Uruguay | 16.9 /100 | #200 | Poor 17.2% |
| Immigrants | Afghanistan | 13.7 /100 | #201 | Poor 17.3% |
| Immigrants | Sierra Leone | 13.4 /100 | #202 | Poor 17.3% |
| Immigrants | Uzbekistan | 13.3 /100 | #203 | Poor 17.3% |
| Ugandans | 12.5 /100 | #204 | Poor 17.3% |
| Immigrants | Portugal | 11.2 /100 | #205 | Poor 17.4% |