Zip Codes with the Highest Percentage of Population with a Degree in Education in Pittsburgh, PA

RELATED REPORTS & OPTIONS

Education
Population
Families and Households
Female Fertility
Female Fertility (Unmarried)
Race (Community Size)
Race (Percentage)
Ancestry (Community Size)
AfghanAfricanAlbanianAlsatianAmericanApacheArabArgentineanArmenianAustralianAustrianBahamianBarbadianBasqueBelgianBhutaneseBlackfeetBolivianBrazilianBritishBritish West IndianBulgarianBurmeseCajunCambodianCanadianCape VerdeanCarpatho RusynCelticCentral AmericanCentral American IndianCherokeeChickasawChileanChippewaChoctawColombianComancheCosta RicanCreekCroatianCubanCypriotCzechCzechoslovakianDanishDelawareDominicanDutchEastern EuropeanEcuadorianEgyptianEnglishEthiopianEuropeanFilipinoFinnishFrenchFrench American IndianFrench CanadianGermanGhanaianGreekGuamanian / ChamorroGuatemalanGuyaneseHaitianHonduranHungarianIndian (Asian)IndonesianIranianIraqiIrishIroquoisIsraeliItalianJamaicanJapaneseJordanianKenyanKoreanLaotianLatvianLebaneseLiberianLithuanianLumbeeLuxembourgerMacedonianMalaysianMalteseMexicanMexican American IndianMongolianMoroccanNative HawaiianNavajoNew ZealanderNicaraguanNigerianNorthern EuropeanNorwegianPakistaniPalestinianPanamanianParaguayanPennsylvania GermanPeruvianPolishPortuguesePuerto RicanRomanianRussianSalvadoranSamoanScandinavianScotch-IrishScottishSeminoleSerbianSiouxSlavicSlovakSloveneSouth AfricanSouth AmericanSouth American IndianSoviet UnionSpaniardSpanishSri LankanSubsaharan AfricanSudaneseSwedishSwissSyrianThaiTrinidadian and TobagonianTurkishU.S. Virgin IslanderUgandanUkrainianUruguayanVenezuelanVietnameseWelshWest IndianYugoslavian
Ancestry (Percentage)
AfghanAfricanAlbanianAlsatianAmericanApacheArabArgentineanArmenianAustralianAustrianBahamianBarbadianBasqueBelgianBhutaneseBlackfeetBolivianBrazilianBritishBritish West IndianBulgarianBurmeseCajunCambodianCanadianCape VerdeanCarpatho RusynCelticCentral AmericanCentral American IndianCherokeeChickasawChileanChippewaChoctawColombianComancheCosta RicanCreekCroatianCubanCypriotCzechCzechoslovakianDanishDelawareDominicanDutchEastern EuropeanEcuadorianEgyptianEnglishEthiopianEuropeanFilipinoFinnishFrenchFrench American IndianFrench CanadianGermanGhanaianGreekGuamanian / ChamorroGuatemalanGuyaneseHaitianHonduranHungarianIndian (Asian)IndonesianIranianIraqiIrishIroquoisIsraeliItalianJamaicanJapaneseJordanianKenyanKoreanLaotianLatvianLebaneseLiberianLithuanianLumbeeLuxembourgerMacedonianMalaysianMalteseMexicanMexican American IndianMongolianMoroccanNative HawaiianNavajoNew ZealanderNicaraguanNigerianNorthern EuropeanNorwegianPakistaniPalestinianPanamanianParaguayanPennsylvania GermanPeruvianPolishPortuguesePuerto RicanRomanianRussianSalvadoranSamoanScandinavianScotch-IrishScottishSeminoleSerbianSiouxSlavicSlovakSloveneSouth AfricanSouth AmericanSouth American IndianSoviet UnionSpaniardSpanishSri LankanSubsaharan AfricanSudaneseSwedishSwissSyrianThaiTrinidadian and TobagonianTurkishU.S. Virgin IslanderUgandanUkrainianUruguayanVenezuelanVietnameseWelshWest IndianYugoslavian
Immigrant Origin (Total)
AfghanistanAfricaAlbaniaArgentinaAsiaAustraliaAustriaBahamasBangladeshBelarusBelgiumBoliviaBosnia and HerzegovinaBrazilBulgariaBurma / MyanmarCambodiaCameroonCanadaCaribbeanCentral AmericaChileChinaColombiaCongoCosta RicaCroatiaCubaCzechoslovakiaDenmarkDominican RepublicEastern AfricaEastern AsiaEastern EuropeEcuadorEgyptEl SalvadorEnglandEritreaEthiopiaEuropeFranceGermanyGhanaGreeceGuatemalaGuyanaHaitiHondurasHong KongHungaryIndiaIndonesiaIranIraqIrelandIsraelItalyJamaicaJapanJordanKazakhstanKenyaKoreaKuwaitLatin AmericaLatviaLebanonLiberiaLithuaniaMalaysiaMexicoMiddle AfricaMoldovaMoroccoNepalNetherlandsNigeriaNorthern AfricaNorthern EuropeNorwayOceaniaPakistanPanamaPeruPhilippinesPolandPortugalRomaniaRussiaSaudi ArabiaScotlandSerbiaSingaporeSouth AfricaSouth AmericaSouth Central AsiaSouth Eastern AsiaSouthern EuropeSpainSri LankaSudanSwedenSwitzerlandSyriaTaiwanThailandTrinidad and TobagoTurkeyUgandaUkraineUzbekistanVenezuelaVietnamWestern AfricaWestern AsiaWestern EuropeZaire
Immigrant Origin (Percentage)
AfghanistanAfricaAlbaniaArgentinaAsiaAustraliaAustriaBahamasBangladeshBelarusBelgiumBoliviaBosnia and HerzegovinaBrazilBulgariaBurma / MyanmarCambodiaCameroonCanadaCaribbeanCentral AmericaChileChinaColombiaCongoCosta RicaCroatiaCubaCzechoslovakiaDenmarkDominican RepublicEastern AfricaEastern AsiaEastern EuropeEcuadorEgyptEl SalvadorEnglandEritreaEthiopiaEuropeFranceGermanyGhanaGreeceGuatemalaGuyanaHaitiHondurasHong KongHungaryIndiaIndonesiaIranIraqIrelandIsraelItalyJamaicaJapanJordanKazakhstanKenyaKoreaKuwaitLatin AmericaLatviaLebanonLiberiaLithuaniaMalaysiaMexicoMiddle AfricaMoldovaMoroccoNepalNetherlandsNigeriaNorthern AfricaNorthern EuropeNorwayOceaniaPakistanPanamaPeruPhilippinesPolandPortugalRomaniaRussiaSaudi ArabiaScotlandSerbiaSingaporeSouth AfricaSouth AmericaSouth Central AsiaSouth Eastern AsiaSouthern EuropeSpainSri LankaSudanSwedenSwitzerlandSyriaTaiwanThailandTrinidad and TobagoTurkeyUgandaUkraineUzbekistanVenezuelaVietnamWestern AfricaWestern AsiaWestern EuropeZaire
Income
Income (Families)
Income (Households)
Poverty
Poverty (Families)
Unemployment
Employment Occupations
Employment Industries
Employer Class
Commute Time
Commute Means
School Enrollment
Education by Degree Field
Occupancy
Finances
Physical Characteristics
Pittsburgh
Compare Zip Codes
Comparison Subject

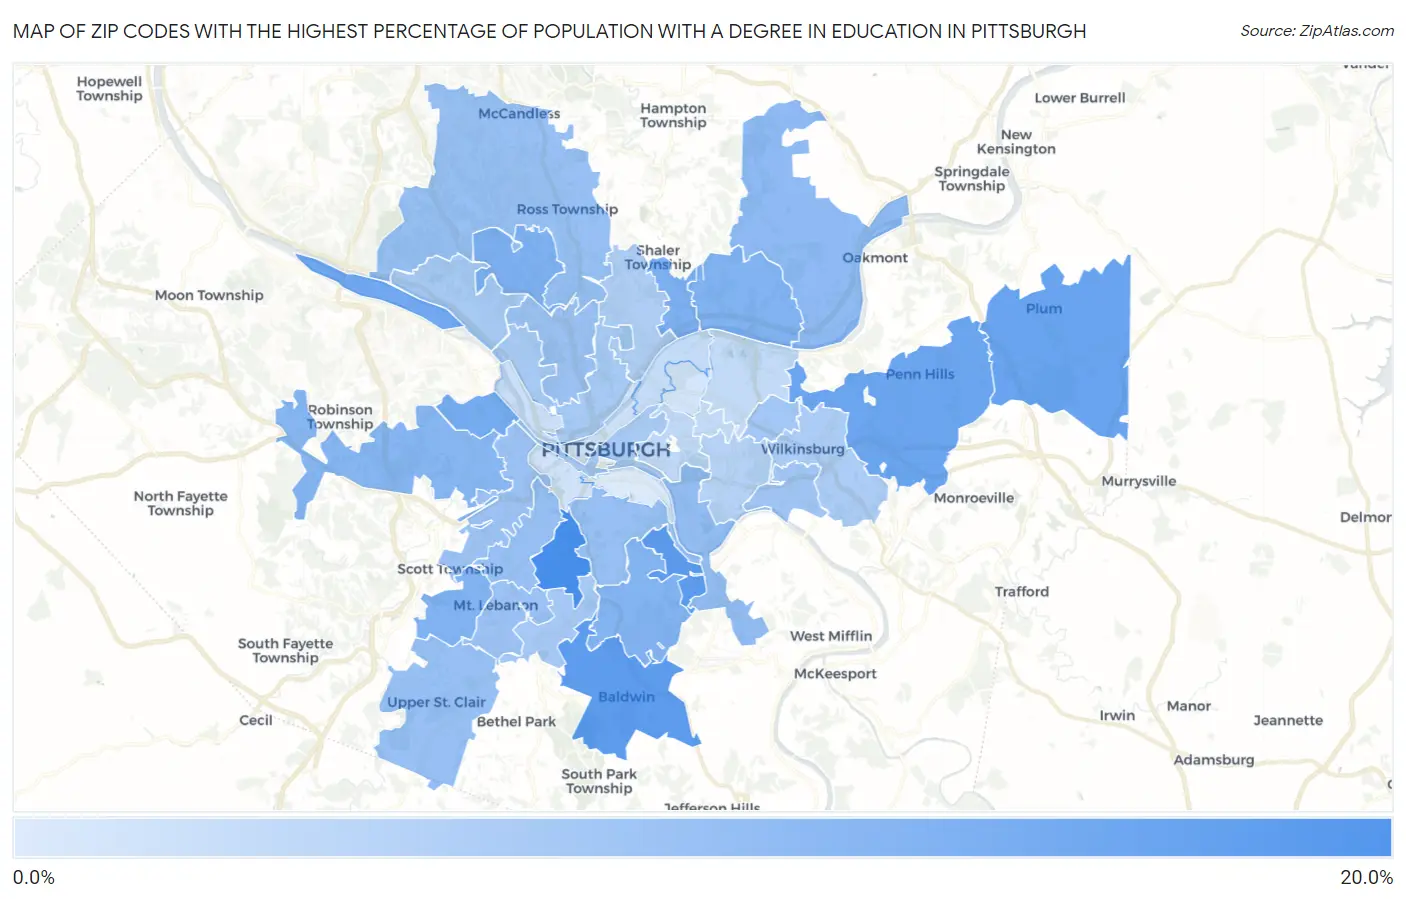
Map of Zip Codes with the Highest Percentage of Population with a Degree in Education in Pittsburgh

0.0%
20.0%
Zip Codes with the Highest Percentage of Population with a Degree in Education in Pittsburgh Map

Zip Codes with the Highest Percentage of Population with a Degree in Education in Pittsburgh, PA

Zip Code % Graduates vs State vs National
1.1522617.6%13.1%(+4.48)#78911.1%(+6.53)#12,763
2.1523615.0%13.1%(+1.89)#97011.1%(+3.94)#15,674
3.1523913.7%13.1%(+0.558)#1,04811.1%(+2.61)#17,451
4.1523513.4%13.1%(+0.297)#1,06611.1%(+2.35)#17,756
5.1522513.1%13.1%(+0.005)#1,09111.1%(+2.06)#18,098
6.1520412.5%13.1%(-0.624)#1,12811.1%(+1.43)#18,957
7.1522911.6%13.1%(-1.55)#1,19011.1%(+0.503)#20,193
8.1522311.5%13.1%(-1.65)#1,19411.1%(+0.398)#20,347
9.1521511.2%13.1%(-1.94)#1,22011.1%(+0.114)#20,738
10.1524311.2%13.1%(-1.94)#1,22111.1%(+0.111)#20,740
11.1522710.9%13.1%(-2.17)#1,23311.1%(-0.123)#21,058
12.1520510.5%13.1%(-2.56)#1,26311.1%(-0.510)#21,581
13.152389.9%13.1%(-3.26)#1,30811.1%(-1.21)#22,558
14.152079.3%13.1%(-3.82)#1,33011.1%(-1.77)#23,304
15.152168.9%13.1%(-4.19)#1,36011.1%(-2.14)#23,792
16.152378.8%13.1%(-4.27)#1,36411.1%(-2.22)#23,882
17.152418.8%13.1%(-4.29)#1,36511.1%(-2.24)#23,915
18.152108.7%13.1%(-4.40)#1,37211.1%(-2.35)#24,038
19.152288.7%13.1%(-4.42)#1,37411.1%(-2.37)#24,069
20.152208.5%13.1%(-4.59)#1,38011.1%(-2.54)#24,249
21.152148.5%13.1%(-4.64)#1,38511.1%(-2.58)#24,308
22.152187.8%13.1%(-5.34)#1,41211.1%(-3.29)#25,130
23.152087.6%13.1%(-5.55)#1,41711.1%(-3.49)#25,308
24.152347.4%13.1%(-5.76)#1,42511.1%(-3.70)#25,544
25.152027.2%13.1%(-5.87)#1,43411.1%(-3.82)#25,665
26.152197.1%13.1%(-6.03)#1,43911.1%(-3.98)#25,831
27.152127.0%13.1%(-6.08)#1,44311.1%(-4.03)#25,889
28.152216.7%13.1%(-6.40)#1,45211.1%(-4.35)#26,201
29.152096.4%13.1%(-6.71)#1,46511.1%(-4.66)#26,482
30.152175.7%13.1%(-7.45)#1,48211.1%(-5.40)#27,090
31.152134.9%13.1%(-8.20)#1,49611.1%(-6.15)#27,615
32.152064.4%13.1%(-8.73)#1,51211.1%(-6.68)#27,970
33.152324.3%13.1%(-8.85)#1,51411.1%(-6.79)#28,029
34.152014.0%13.1%(-9.07)#1,51911.1%(-7.02)#28,185
35.152333.4%13.1%(-9.74)#1,52711.1%(-7.69)#28,548
36.152223.2%13.1%(-9.93)#1,53011.1%(-7.88)#28,621
37.152113.0%13.1%(-10.2)#1,53111.1%(-8.10)#28,704
38.152242.7%13.1%(-10.4)#1,53411.1%(-8.39)#28,809
39.152031.8%13.1%(-11.3)#1,53611.1%(-9.23)#29,024

Common Questions

What are the Top 10 Zip Codes with the Highest Percentage of Population with a Degree in Education in Pittsburgh, PA?
Top 10 Zip Codes with the Highest Percentage of Population with a Degree in Education in Pittsburgh, PA are:
#1
17.6%
#2
15.0%
#3
13.7%
#4
13.4%
#5
13.1%
#6
12.5%
#7
11.6%
#8
11.5%
#9
11.2%
#10
11.2%
What zip code has the Highest Percentage of Population with a Degree in Education in Pittsburgh, PA?
15226 has the Highest Percentage of Population with a Degree in Education in Pittsburgh, PA with 17.6%.
What is the Percentage of Population with a Degree in Education in Pittsburgh, PA?
Percentage of Population with a Degree in Education in Pittsburgh is 6.1%.
What is the Percentage of Population with a Degree in Education in Pennsylvania?
Percentage of Population with a Degree in Education in Pennsylvania is 13.1%.
What is the Percentage of Population with a Degree in Education in the United States?
Percentage of Population with a Degree in Education in the United States is 11.1%.