Zip Codes with the Highest Percentage of Households Without a Vehicle in Rome, NY
RELATED REPORTS & OPTIONS
Households without a Cars
Rome
Compare Zip Codes
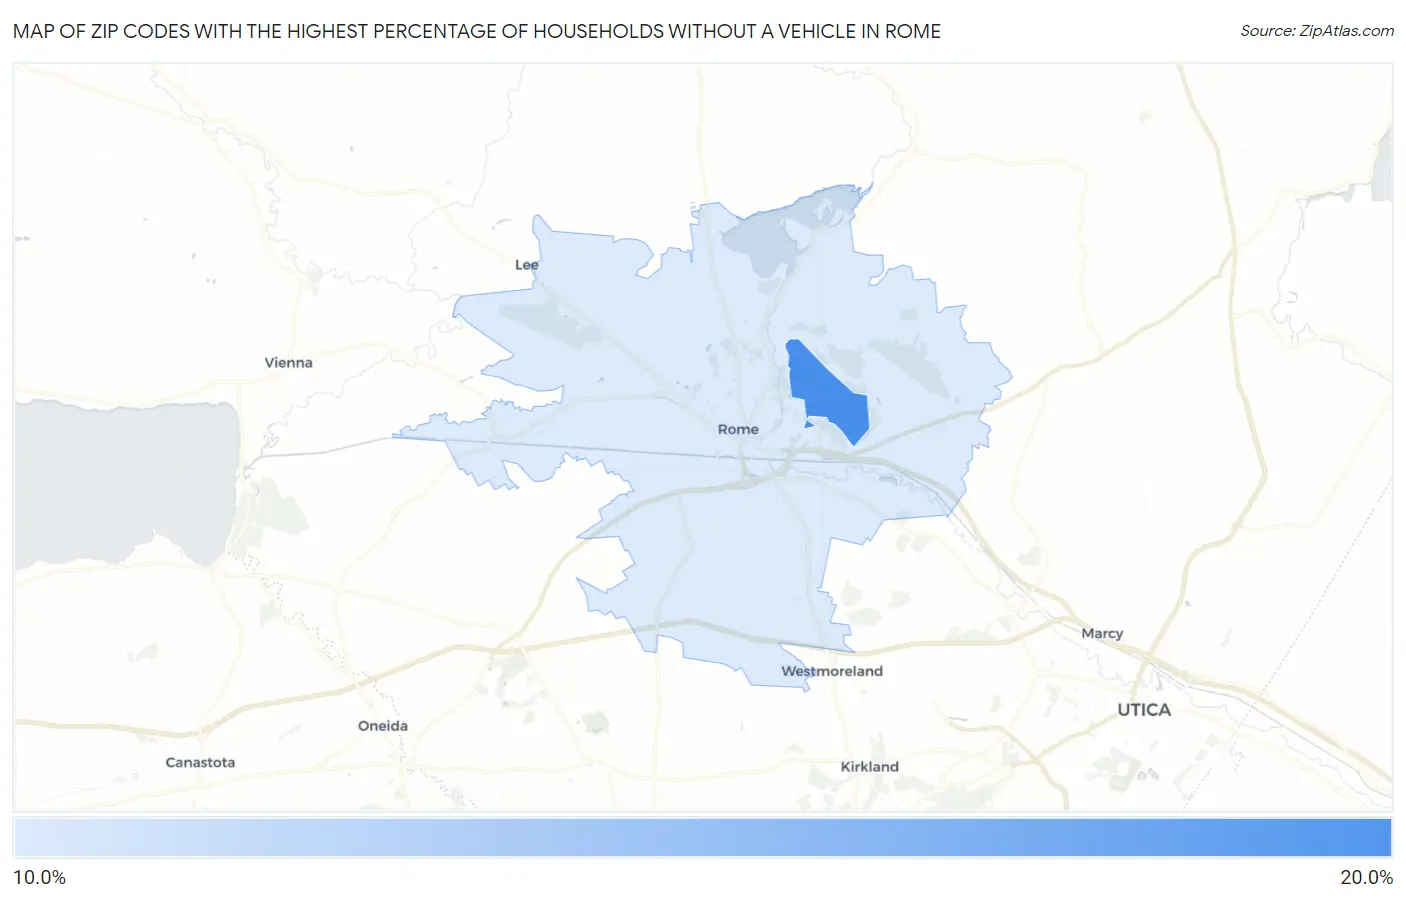
Map of Zip Codes with the Highest Percentage of Households Without a Vehicle in Rome
0.0%
20.0%
Zip Codes with the Highest Percentage of Households Without a Vehicle in Rome, NY
| Zip Code | Housholds Without a Car | vs State | vs National | |
| 1. | 13441 | 17.8% | 29.0%(-11.2)#277 | 8.3%(+9.50)#1,835 |
| 2. | 13440 | 11.9% | 29.0%(-17.1)#395 | 8.3%(+3.60)#3,601 |
1
Common Questions
What are the Top Zip Codes with the Highest Percentage of Households Without a Vehicle in Rome, NY?
Top Zip Codes with the Highest Percentage of Households Without a Vehicle in Rome, NY are:
What zip code has the Highest Percentage of Households Without a Vehicle in Rome, NY?
13441 has the Highest Percentage of Households Without a Vehicle in Rome, NY with 17.8%.
What is the Percentage of Households Without a Vehicle in Rome, NY?
Percentage of Households Without a Vehicle in Rome is 14.5%.
What is the Percentage of Households Without a Vehicle in New York?
Percentage of Households Without a Vehicle in New York is 29.0%.
What is the Percentage of Households Without a Vehicle in the United States?
Percentage of Households Without a Vehicle in the United States is 8.3%.