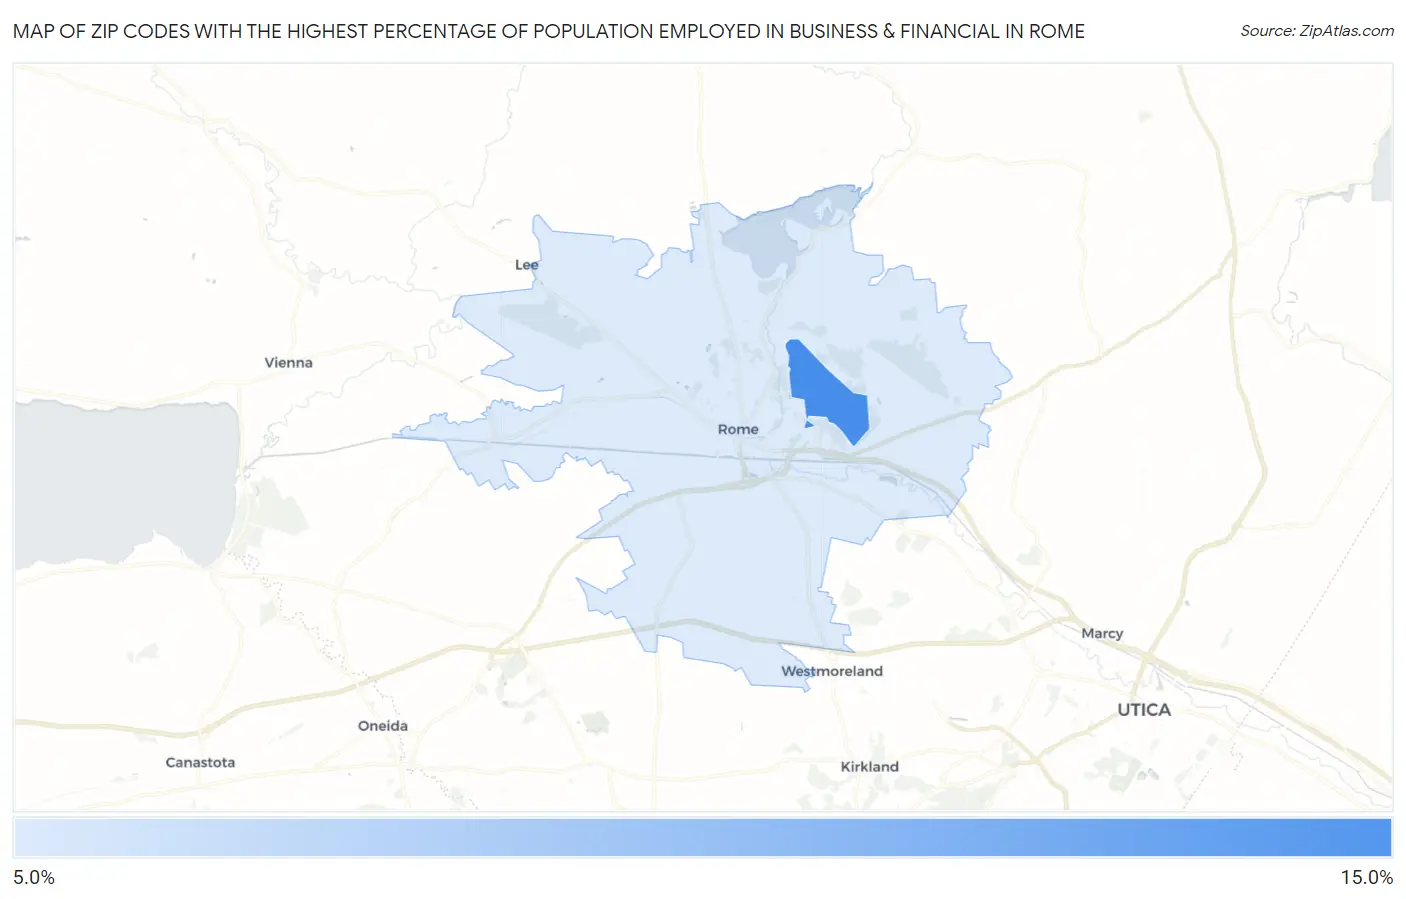
Zip Codes with the Highest Percentage of Population Employed in Business & Financial in Rome, NY
RELATED REPORTS & OPTIONS
Business & Financial
Rome
Compare Zip Codes
Map of Zip Codes with the Highest Percentage of Population Employed in Business & Financial in Rome
0.0%
15.0%
Zip Codes with the Highest Percentage of Population Employed in Business & Financial in Rome, NY
| Zip Code | % Employed | vs State | vs National | |
| 1. | 13441 | 14.5% | 6.2%(+8.37)#57 | 5.8%(+8.76)#667 |
| 2. | 13440 | 6.4% | 6.2%(+0.204)#469 | 5.8%(+0.592)#7,055 |
1
Common Questions
What are the Top Zip Codes with the Highest Percentage of Population Employed in Business & Financial in Rome, NY?
Top Zip Codes with the Highest Percentage of Population Employed in Business & Financial in Rome, NY are:
What zip code has the Highest Percentage of Population Employed in Business & Financial in Rome, NY?
13441 has the Highest Percentage of Population Employed in Business & Financial in Rome, NY with 14.5%.
What is the Percentage of Population Employed in Business & Financial in Rome, NY?
Percentage of Population Employed in Business & Financial in Rome is 6.0%.
What is the Percentage of Population Employed in Business & Financial in New York?
Percentage of Population Employed in Business & Financial in New York is 6.2%.
What is the Percentage of Population Employed in Business & Financial in the United States?
Percentage of Population Employed in Business & Financial in the United States is 5.8%.