Zip Codes with the Highest Percentage of Population Employed in Real Estate, Rental & Leasing in Rio Rancho, NM
RELATED REPORTS & OPTIONS
Real Estate, Rental & Leasing
Rio Rancho
Compare Zip Codes
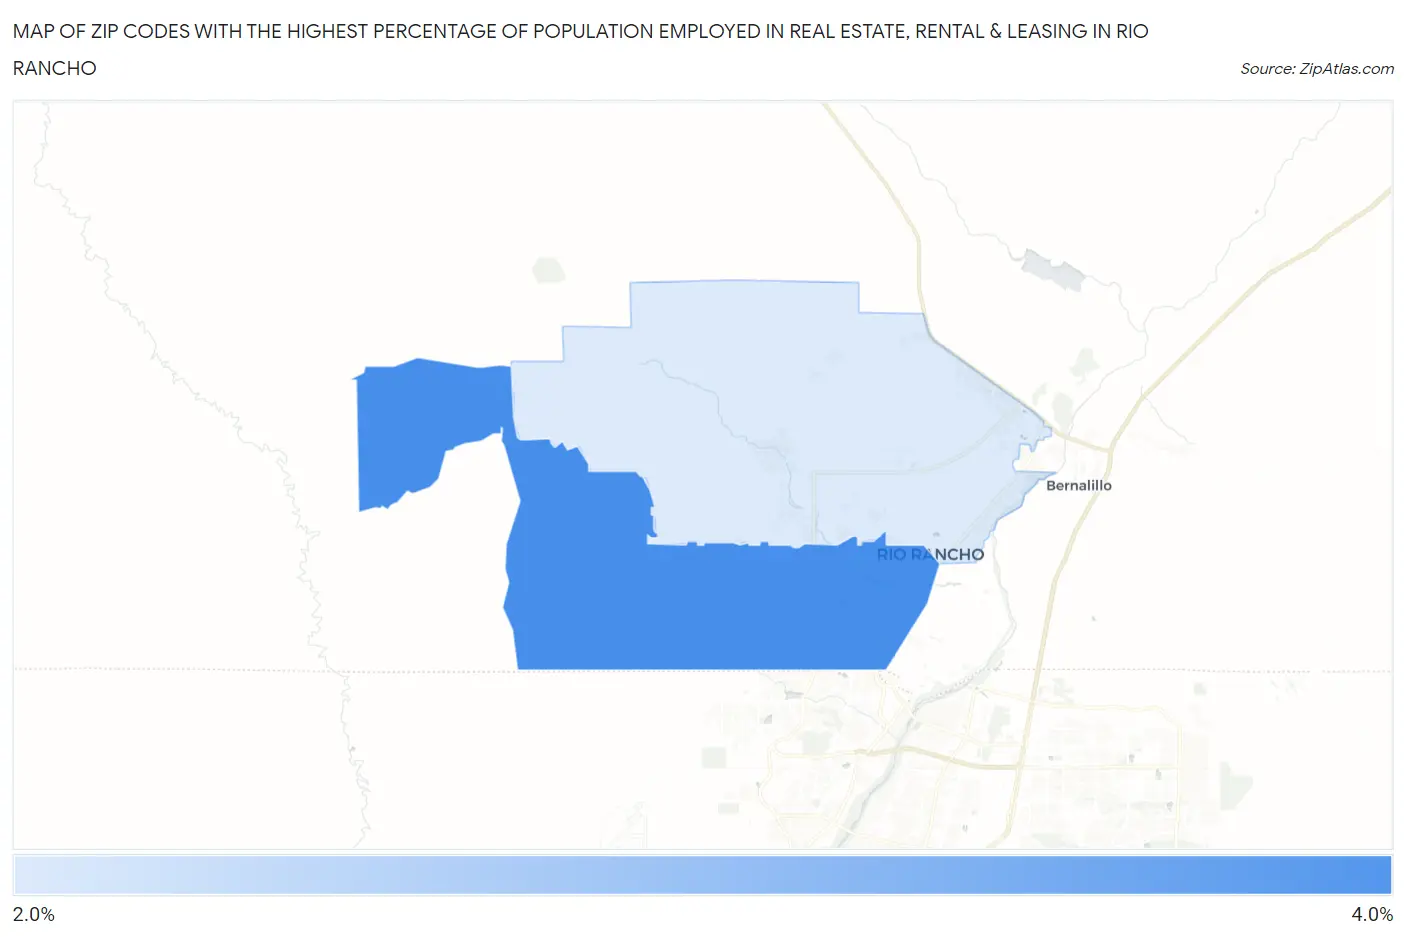
Map of Zip Codes with the Highest Percentage of Population Employed in Real Estate, Rental & Leasing in Rio Rancho
0.0%
4.0%
Zip Codes with the Highest Percentage of Population Employed in Real Estate, Rental & Leasing in Rio Rancho, NM
| Zip Code | % Employed | vs State | vs National | |
| 1. | 87124 | 3.4% | 1.6%(+1.77)#27 | 1.9%(+1.46)#3,125 |
| 2. | 87144 | 2.8% | 1.6%(+1.26)#37 | 1.9%(+0.953)#4,311 |
1
Common Questions
What are the Top Zip Codes with the Highest Percentage of Population Employed in Real Estate, Rental & Leasing in Rio Rancho, NM?
Top Zip Codes with the Highest Percentage of Population Employed in Real Estate, Rental & Leasing in Rio Rancho, NM are:
What zip code has the Highest Percentage of Population Employed in Real Estate, Rental & Leasing in Rio Rancho, NM?
87124 has the Highest Percentage of Population Employed in Real Estate, Rental & Leasing in Rio Rancho, NM with 3.4%.
What is the Percentage of Population Employed in Real Estate, Rental & Leasing in Rio Rancho, NM?
Percentage of Population Employed in Real Estate, Rental & Leasing in Rio Rancho is 3.2%.
What is the Percentage of Population Employed in Real Estate, Rental & Leasing in New Mexico?
Percentage of Population Employed in Real Estate, Rental & Leasing in New Mexico is 1.6%.
What is the Percentage of Population Employed in Real Estate, Rental & Leasing in the United States?
Percentage of Population Employed in Real Estate, Rental & Leasing in the United States is 1.9%.