Zip Codes with the Highest Percentage of Population Employed in Security & Protection in Mooresville, NC
RELATED REPORTS & OPTIONS
Security & Protection
Mooresville
Compare Zip Codes
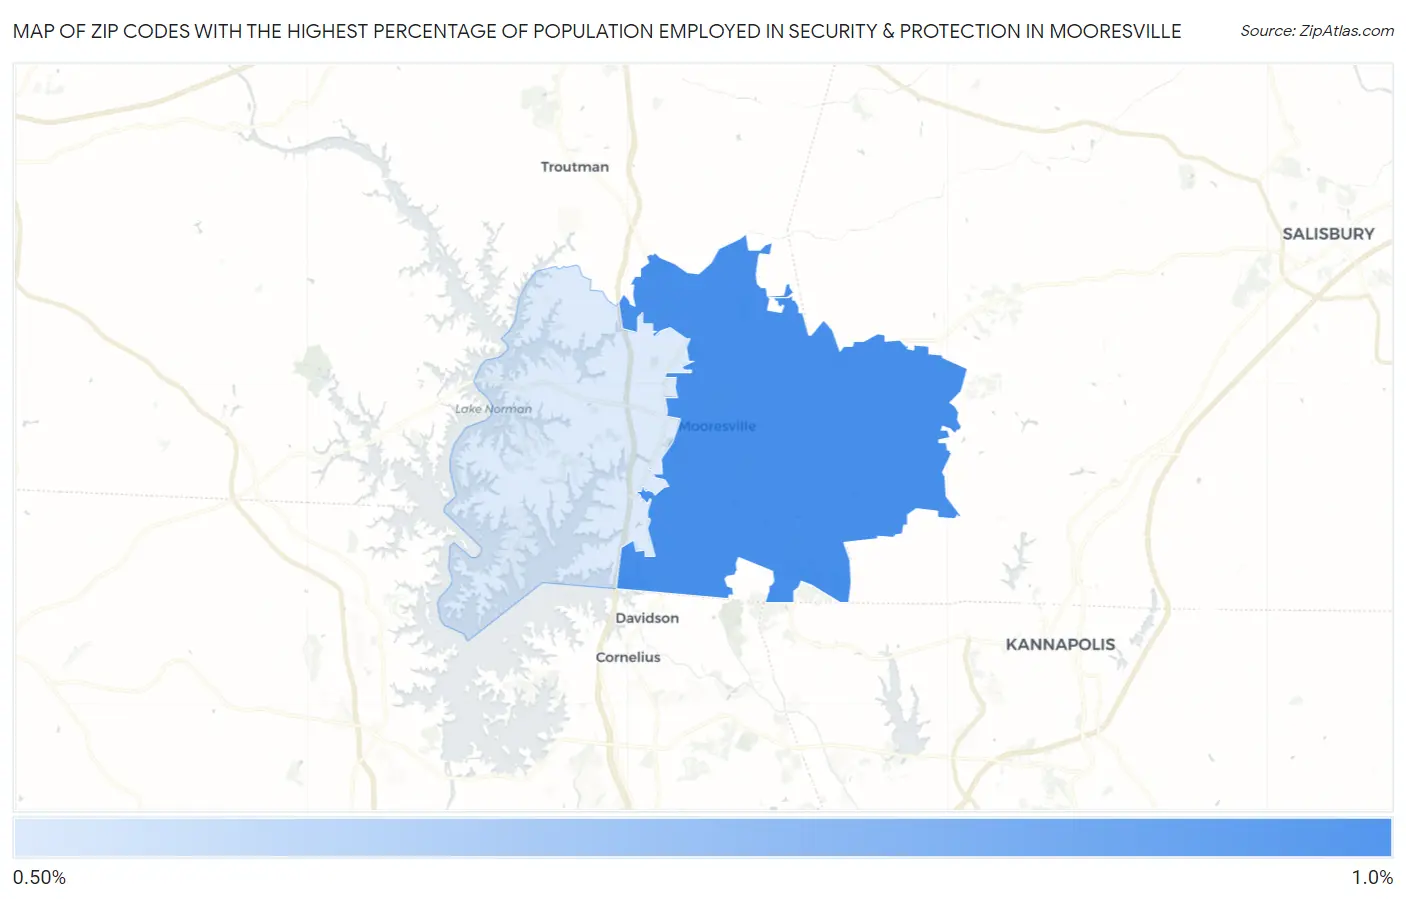
Map of Zip Codes with the Highest Percentage of Population Employed in Security & Protection in Mooresville
0.0%
1.0%
Zip Codes with the Highest Percentage of Population Employed in Security & Protection in Mooresville, NC
| Zip Code | % Employed | vs State | vs National | |
| 1. | 28115 | 0.97% | 1.9%(-0.925)#564 | 2.1%(-1.18)#20,303 |
| 2. | 28117 | 0.57% | 1.9%(-1.32)#624 | 2.1%(-1.58)#22,831 |
1
Common Questions
What are the Top Zip Codes with the Highest Percentage of Population Employed in Security & Protection in Mooresville, NC?
Top Zip Codes with the Highest Percentage of Population Employed in Security & Protection in Mooresville, NC are:
What zip code has the Highest Percentage of Population Employed in Security & Protection in Mooresville, NC?
28115 has the Highest Percentage of Population Employed in Security & Protection in Mooresville, NC with 0.97%.
What is the Percentage of Population Employed in Security & Protection in Mooresville, NC?
Percentage of Population Employed in Security & Protection in Mooresville is 0.80%.
What is the Percentage of Population Employed in Security & Protection in North Carolina?
Percentage of Population Employed in Security & Protection in North Carolina is 1.9%.
What is the Percentage of Population Employed in Security & Protection in the United States?
Percentage of Population Employed in Security & Protection in the United States is 2.1%.