Zip Codes with the Highest Percentage of Population Employed in Real Estate, Rental & Leasing in Vicksburg, MS
RELATED REPORTS & OPTIONS
Real Estate, Rental & Leasing
Vicksburg
Compare Zip Codes
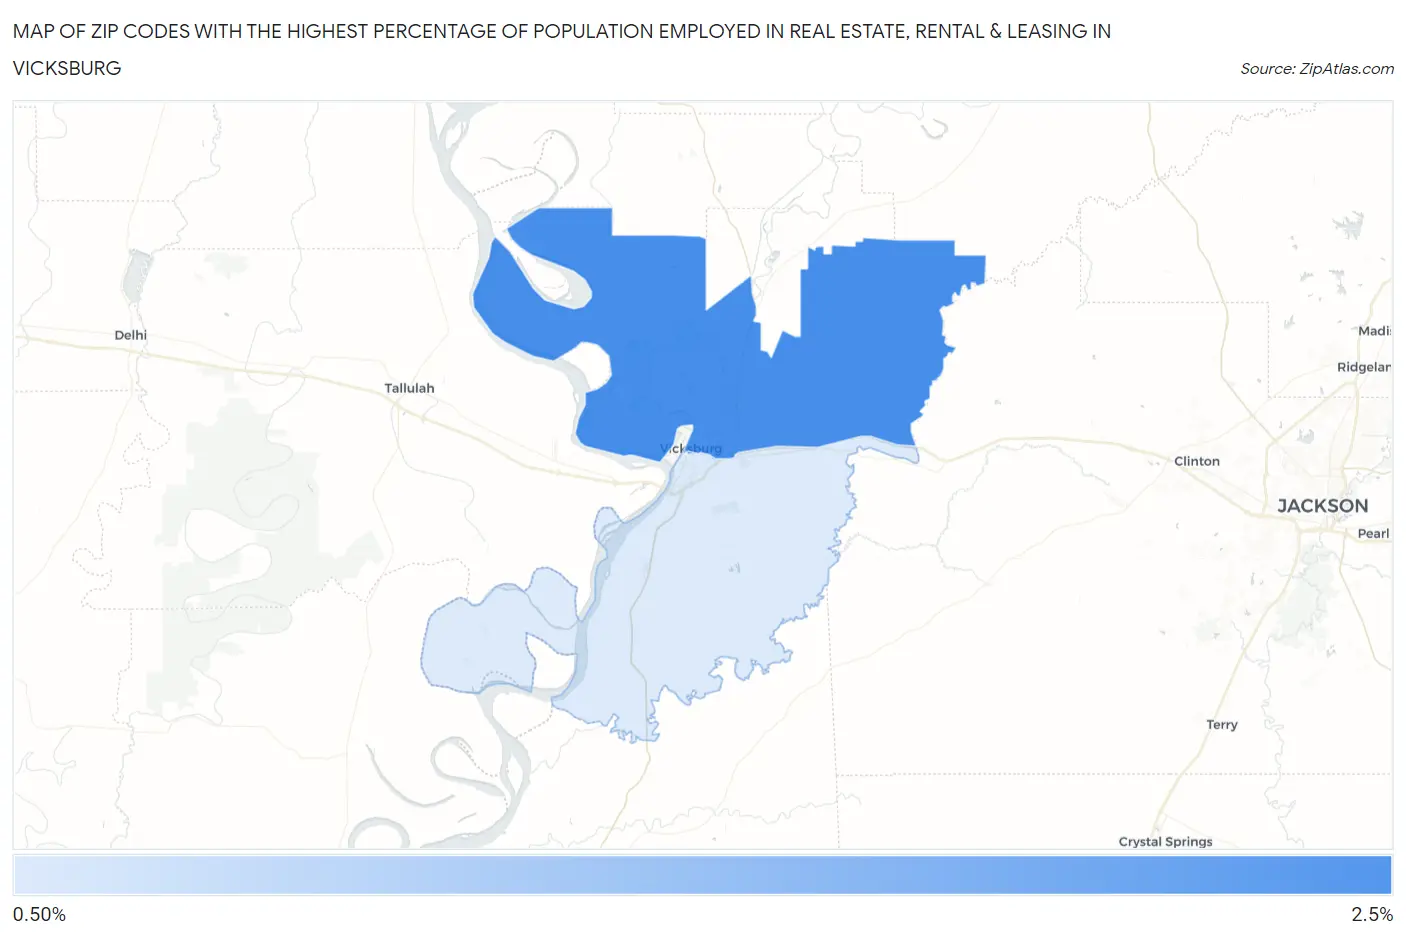
Map of Zip Codes with the Highest Percentage of Population Employed in Real Estate, Rental & Leasing in Vicksburg
0.0%
2.5%
Zip Codes with the Highest Percentage of Population Employed in Real Estate, Rental & Leasing in Vicksburg, MS
| Zip Code | % Employed | vs State | vs National | |
| 1. | 39183 | 2.1% | 1.3%(+0.846)#42 | 1.9%(+0.205)#7,336 |
| 2. | 39180 | 1.2% | 1.3%(-0.010)#100 | 1.9%(-0.651)#13,159 |
1
Common Questions
What are the Top Zip Codes with the Highest Percentage of Population Employed in Real Estate, Rental & Leasing in Vicksburg, MS?
Top Zip Codes with the Highest Percentage of Population Employed in Real Estate, Rental & Leasing in Vicksburg, MS are:
What zip code has the Highest Percentage of Population Employed in Real Estate, Rental & Leasing in Vicksburg, MS?
39183 has the Highest Percentage of Population Employed in Real Estate, Rental & Leasing in Vicksburg, MS with 2.1%.
What is the Percentage of Population Employed in Real Estate, Rental & Leasing in Vicksburg, MS?
Percentage of Population Employed in Real Estate, Rental & Leasing in Vicksburg is 0.97%.
What is the Percentage of Population Employed in Real Estate, Rental & Leasing in Mississippi?
Percentage of Population Employed in Real Estate, Rental & Leasing in Mississippi is 1.3%.
What is the Percentage of Population Employed in Real Estate, Rental & Leasing in the United States?
Percentage of Population Employed in Real Estate, Rental & Leasing in the United States is 1.9%.