Zip Codes with the Most Immigrants from South Central Asia in Blue Springs, MO
RELATED REPORTS & OPTIONS
South Central Asia
Blue Springs
Compare Zip Codes
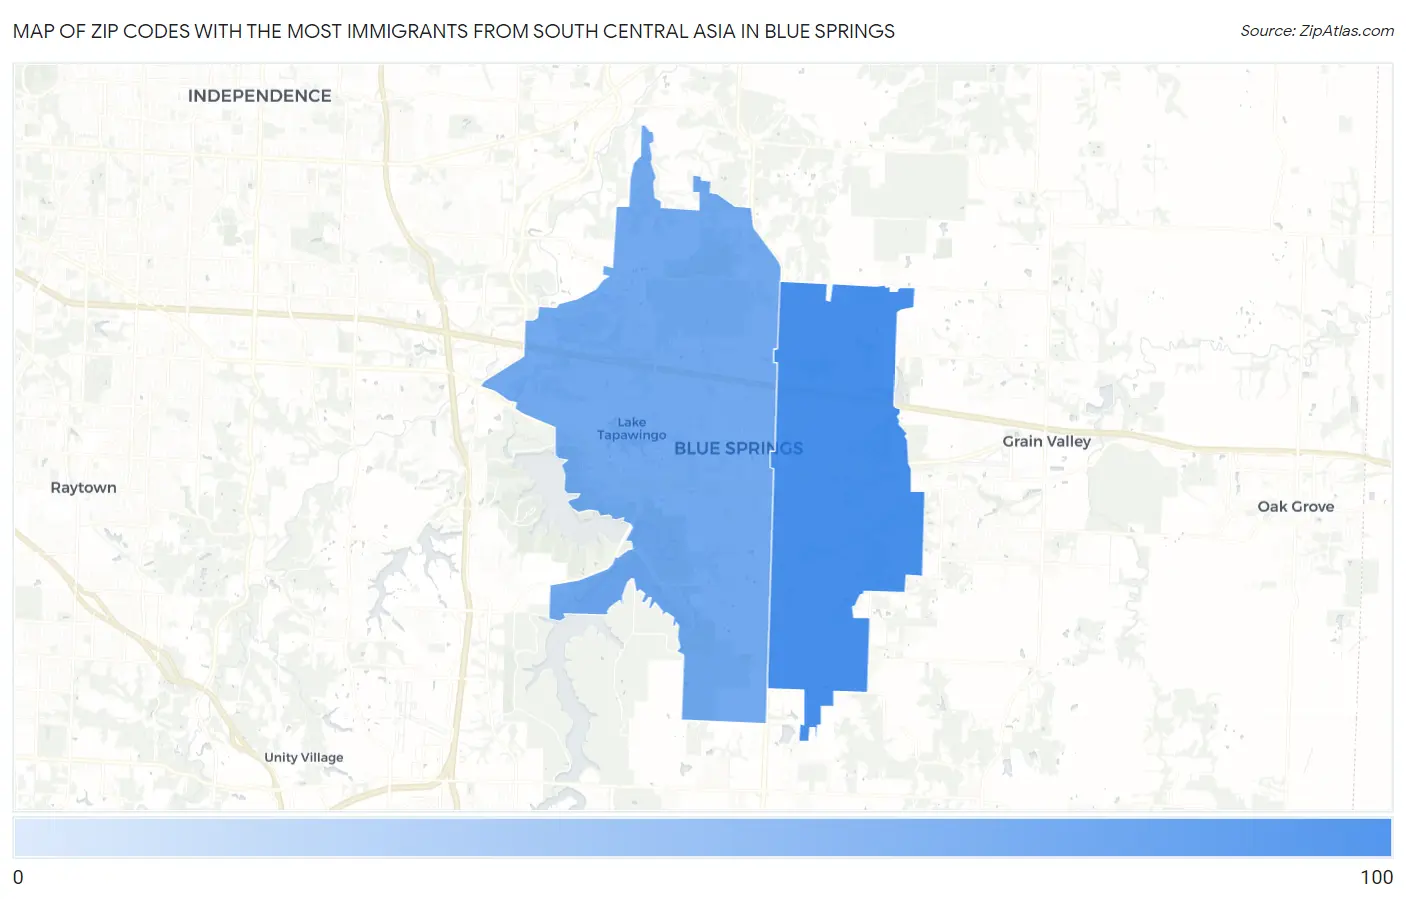
Map of Zip Codes with the Most Immigrants from South Central Asia in Blue Springs
0
100
Zip Codes with the Most Immigrants from South Central Asia in Blue Springs, MO
| Zip Code | South Central Asia | vs State | vs National | |
| 1. | 64014 | 87 | 32,457(0.27%)#77 | 4,330,976(0.00%)#5,686 |
| 2. | 64015 | 23 | 32,457(0.07%)#124 | 4,330,976(0.00%)#8,298 |
1
Common Questions
What are the Top Zip Codes with the Most Immigrants from South Central Asia in Blue Springs, MO?
Top Zip Codes with the Most Immigrants from South Central Asia in Blue Springs, MO are:
What zip code has the Most Immigrants from South Central Asia in Blue Springs, MO?
64014 has the Most Immigrants from South Central Asia in Blue Springs, MO with 87.
What is the Total Immigrants from South Central Asia in Blue Springs, MO?
Total Immigrants from South Central Asia in Blue Springs is 117.
What is the Total Immigrants from South Central Asia in Missouri?
Total Immigrants from South Central Asia in Missouri is 32,457.
What is the Total Immigrants from South Central Asia in the United States?
Total Immigrants from South Central Asia in the United States is 4,330,976.