Zip Codes with the Highest Percentage of Population Employed in Arts, Entertainment & Recreation in Blue Springs, MO
RELATED REPORTS & OPTIONS
Arts, Entertainment & Recreation
Blue Springs
Compare Zip Codes
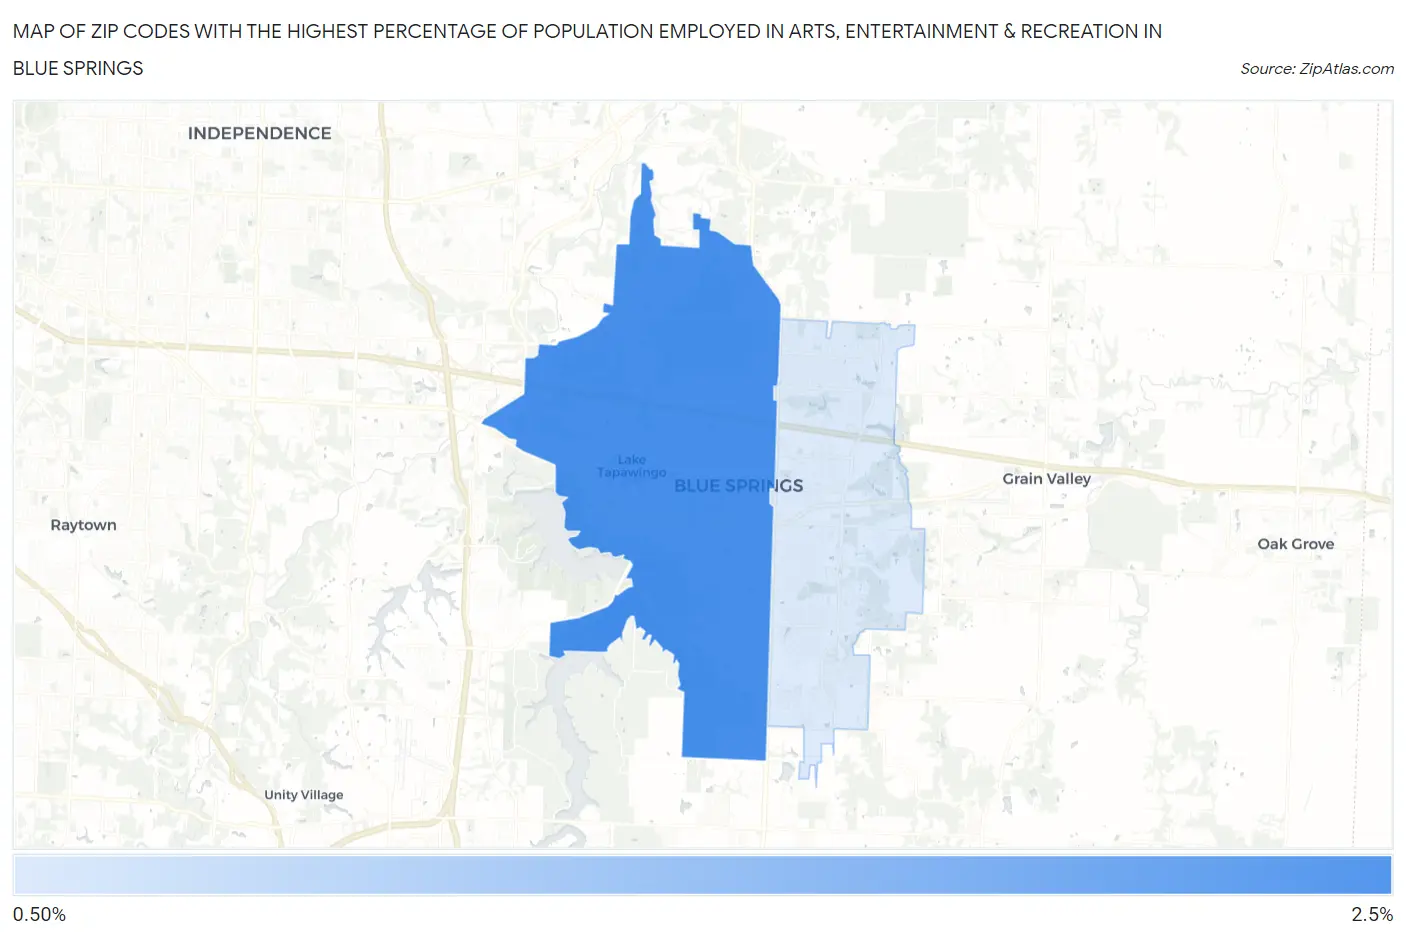
Map of Zip Codes with the Highest Percentage of Population Employed in Arts, Entertainment & Recreation in Blue Springs
0.0%
2.5%
Zip Codes with the Highest Percentage of Population Employed in Arts, Entertainment & Recreation in Blue Springs, MO
| Zip Code | % Employed | vs State | vs National | |
| 1. | 64015 | 2.0% | 1.8%(+0.199)#196 | 2.1%(-0.049)#9,587 |
| 2. | 64014 | 1.4% | 1.8%(-0.390)#302 | 2.1%(-0.639)#13,649 |
1
Common Questions
What are the Top Zip Codes with the Highest Percentage of Population Employed in Arts, Entertainment & Recreation in Blue Springs, MO?
Top Zip Codes with the Highest Percentage of Population Employed in Arts, Entertainment & Recreation in Blue Springs, MO are:
What zip code has the Highest Percentage of Population Employed in Arts, Entertainment & Recreation in Blue Springs, MO?
64015 has the Highest Percentage of Population Employed in Arts, Entertainment & Recreation in Blue Springs, MO with 2.0%.
What is the Percentage of Population Employed in Arts, Entertainment & Recreation in Blue Springs, MO?
Percentage of Population Employed in Arts, Entertainment & Recreation in Blue Springs is 1.7%.
What is the Percentage of Population Employed in Arts, Entertainment & Recreation in Missouri?
Percentage of Population Employed in Arts, Entertainment & Recreation in Missouri is 1.8%.
What is the Percentage of Population Employed in Arts, Entertainment & Recreation in the United States?
Percentage of Population Employed in Arts, Entertainment & Recreation in the United States is 2.1%.