Zip Codes with the Highest Percentage of Population Employed in Security & Protection in Hopkins, MN
RELATED REPORTS & OPTIONS
Security & Protection
Hopkins
Compare Zip Codes
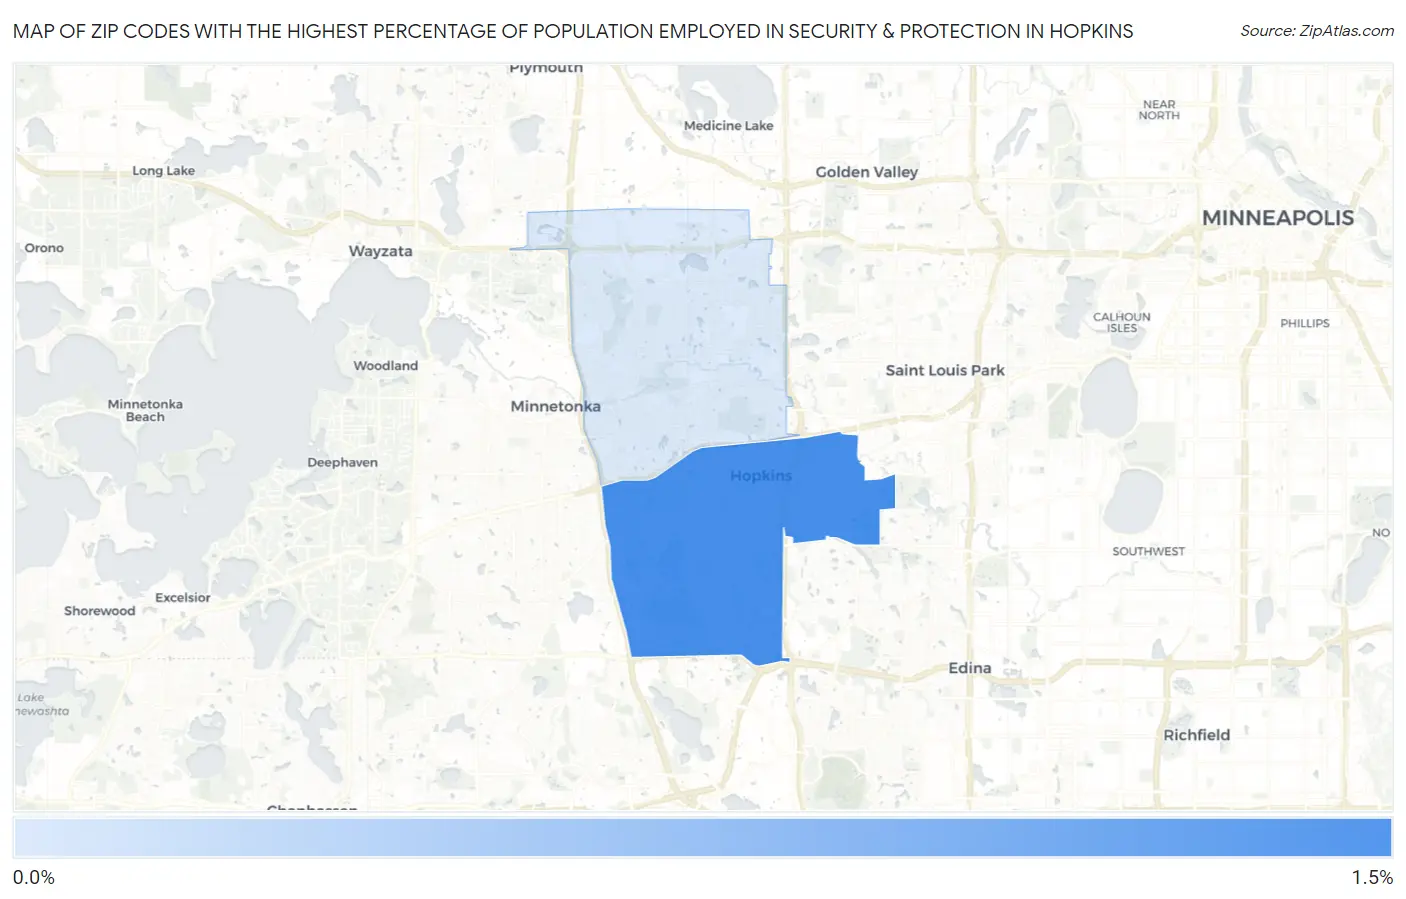
Map of Zip Codes with the Highest Percentage of Population Employed in Security & Protection in Hopkins
0.0%
1.5%
Zip Codes with the Highest Percentage of Population Employed in Security & Protection in Hopkins, MN
| Zip Code | % Employed | vs State | vs National | |
| 1. | 55343 | 1.1% | 1.3%(-0.256)#389 | 2.1%(-1.09)#19,557 |
| 2. | 55305 | 0.21% | 1.3%(-1.11)#694 | 2.1%(-1.94)#24,508 |
1
Common Questions
What are the Top Zip Codes with the Highest Percentage of Population Employed in Security & Protection in Hopkins, MN?
Top Zip Codes with the Highest Percentage of Population Employed in Security & Protection in Hopkins, MN are:
What zip code has the Highest Percentage of Population Employed in Security & Protection in Hopkins, MN?
55343 has the Highest Percentage of Population Employed in Security & Protection in Hopkins, MN with 1.1%.
What is the Percentage of Population Employed in Security & Protection in Hopkins, MN?
Percentage of Population Employed in Security & Protection in Hopkins is 0.88%.
What is the Percentage of Population Employed in Security & Protection in Minnesota?
Percentage of Population Employed in Security & Protection in Minnesota is 1.3%.
What is the Percentage of Population Employed in Security & Protection in the United States?
Percentage of Population Employed in Security & Protection in the United States is 2.1%.