Zip Codes with the Highest Percentage of Population with a Degree in Liberal Arts and History in Cambridge, MA
RELATED REPORTS & OPTIONS
Liberal Arts and History
Cambridge
Compare Zip Codes
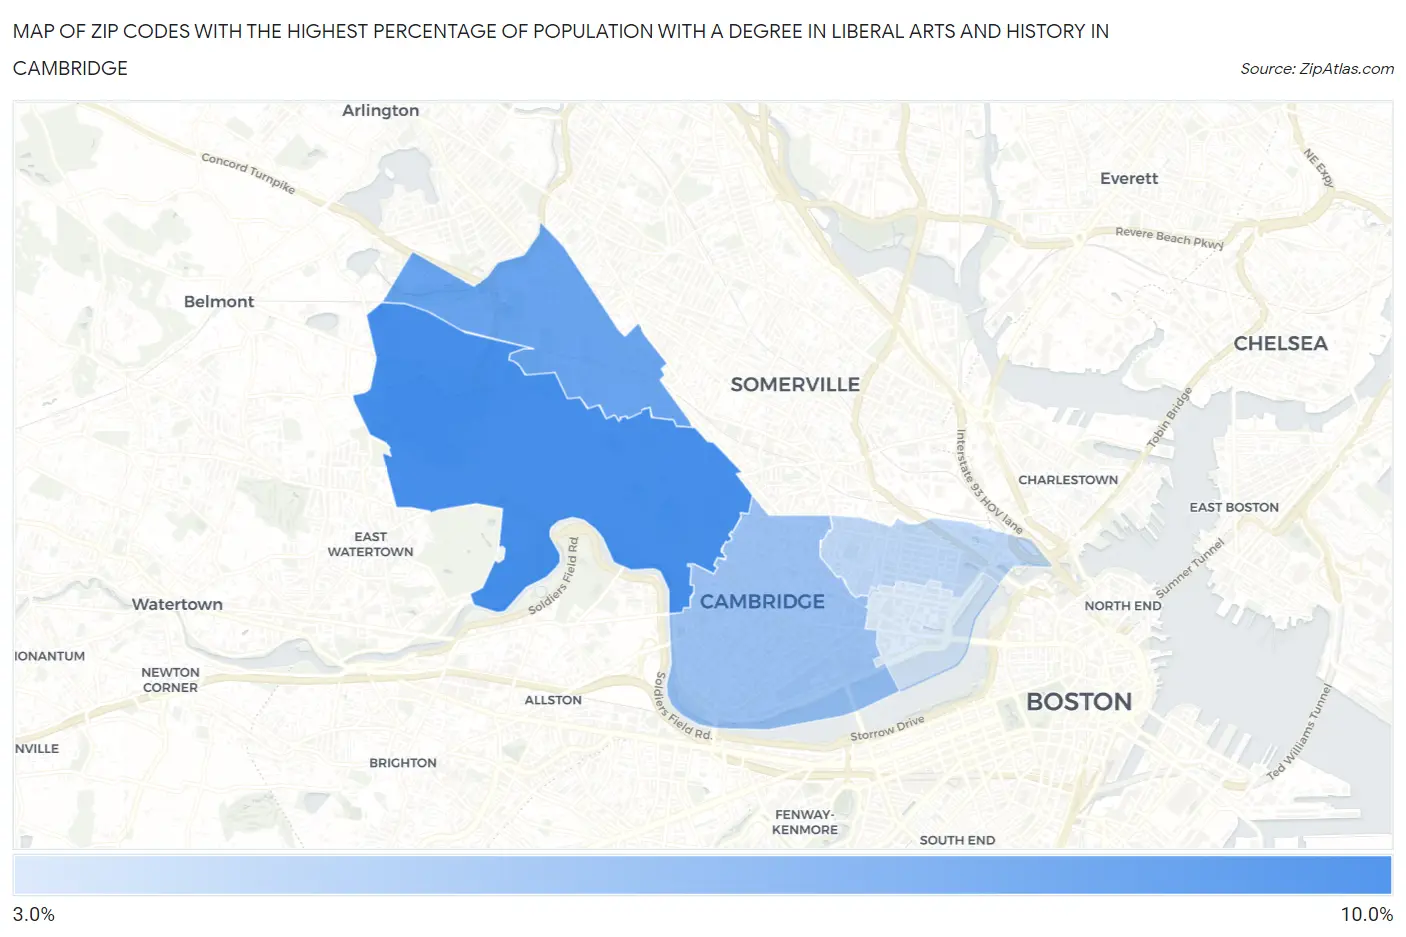
Map of Zip Codes with the Highest Percentage of Population with a Degree in Liberal Arts and History in Cambridge
0.0%
10.0%
Zip Codes with the Highest Percentage of Population with a Degree in Liberal Arts and History in Cambridge, MA
| Zip Code | % Graduates | vs State | vs National | |
| 1. | 02138 | 9.4% | 5.5%(+3.94)#58 | 4.9%(+4.55)#3,516 |
| 2. | 02140 | 8.0% | 5.5%(+2.55)#99 | 4.9%(+3.16)#4,858 |
| 3. | 02139 | 6.1% | 5.5%(+0.667)#183 | 4.9%(+1.28)#8,145 |
| 4. | 02141 | 4.8% | 5.5%(-0.682)#293 | 4.9%(-0.073)#11,973 |
| 5. | 02142 | 3.6% | 5.5%(-1.85)#383 | 4.9%(-1.24)#16,118 |
1
Common Questions
What are the Top 3 Zip Codes with the Highest Percentage of Population with a Degree in Liberal Arts and History in Cambridge, MA?
Top 3 Zip Codes with the Highest Percentage of Population with a Degree in Liberal Arts and History in Cambridge, MA are:
What zip code has the Highest Percentage of Population with a Degree in Liberal Arts and History in Cambridge, MA?
02138 has the Highest Percentage of Population with a Degree in Liberal Arts and History in Cambridge, MA with 9.4%.
What is the Percentage of Population with a Degree in Liberal Arts and History in Cambridge, MA?
Percentage of Population with a Degree in Liberal Arts and History in Cambridge is 7.3%.
What is the Percentage of Population with a Degree in Liberal Arts and History in Massachusetts?
Percentage of Population with a Degree in Liberal Arts and History in Massachusetts is 5.5%.
What is the Percentage of Population with a Degree in Liberal Arts and History in the United States?
Percentage of Population with a Degree in Liberal Arts and History in the United States is 4.9%.