Yaqui vs Hopi In Labor Force | Age 20-24

COMPARE

Yaqui
Race
Ancestry
AfghanAfricanAlaska NativeAlaskan AthabascanAlbanianAleutAlsatianAmericanApacheArabArapahoArgentineanArmenianAssyrian/Chaldean/SyriacAustralianAustrianBahamianBangladeshiBarbadianBasqueBelgianBelizeanBermudanBhutaneseBlackfeetBolivianBrazilianBritishBritish West IndianBulgarianBurmeseCajunCambodianCanadianCape VerdeanCarpatho RusynCelticCentral AmericanCentral American IndianCherokeeCheyenneChickasawChileanChineseChippewaChoctawColombianColvilleComancheCosta RicanCreeCreekCroatianCrowCubanCypriotCzechCzechoslovakianDanishDelawareDominicanDutchDutch West IndianEastern EuropeanEcuadorianEgyptianEnglishEstonianEthiopianEuropeanFijianFilipinoFinnishFrenchFrench American IndianFrench CanadianGermanGerman RussianGhanaianGreekGuamanian/ChamorroGuatemalanGuyaneseHaitianHmongHonduranHoumaHungarianIcelanderIndian (Asian)IndonesianInupiatIranianIraqiIrishIroquoisIsraeliItalianJamaicanJapaneseJordanianKenyanKiowaKoreanLaotianLatvianLebaneseLiberianLithuanianLumbeeLuxembourgerMacedonianMalaysianMalteseMarshalleseMenomineeMexicanMexican American IndianMongolianMoroccanNative HawaiianNavajoNepaleseNew ZealanderNicaraguanNigerianNorthern EuropeanNorwegianOkinawanOsageOttawaPaiutePakistaniPalestinianPanamanianParaguayanPennsylvania GermanPeruvianPimaPolishPortuguesePotawatomiPuebloPuerto RicanPuget Sound SalishRomanianRussianSalvadoranSamoanScandinavianScotch-IrishScottishSeminoleSenegaleseSerbianShoshoneSierra LeoneanSiouxSlavicSlovakSloveneSomaliSouth AfricanSouth AmericanSouth American IndianSoviet UnionSpaniardSpanishSpanish AmericanSpanish American IndianSri LankanSubsaharan AfricanSudaneseSwedishSwissSyrianTaiwaneseThaiTlingit-HaidaTohono O'OdhamTonganTrinidadian and TobagonianTsimshianTurkishU.S. Virgin IslanderUgandanUkrainianUruguayanUteVenezuelanVietnameseWelshWest IndianYakamaYaquiYugoslavianYumanYup'ikZimbabwean
Immigration
NonimmigrantsImmigrantsAfghanistanAfricaAlbaniaArgentinaArmeniaAsiaAustraliaAustriaBahamasBangladeshBarbadosBelarusBelgiumBelizeBoliviaBosnia and HerzegovinaBrazilBulgariaBurma/MyanmarCabo VerdeCambodiaCameroonCanadaCaribbeanCentral AmericaChileChinaColombiaCongoCosta RicaCroatiaCubaCzechoslovakiaDenmarkDominicaDominican RepublicEastern AfricaEastern AsiaEastern EuropeEcuadorEgyptEl SalvadorEnglandEritreaEthiopiaEuropeFijiFranceGermanyGhanaGreeceGrenadaGuatemalaGuyanaHaitiHondurasHong KongHungaryIndiaIndonesiaIranIraqIrelandIsraelItalyJamaicaJapanJordanKazakhstanKenyaKoreaKuwaitLaosLatin AmericaLatviaLebanonLiberiaLithuaniaMalaysiaMexicoMicronesiaMiddle AfricaMoldovaMoroccoNepalNetherlandsNicaraguaNigeriaNorth AmericaNorth MacedoniaNorthern AfricaNorthern EuropeNorwayOceaniaPakistanPanamaPeruPhilippinesPolandPortugalRomaniaRussiaSaudi ArabiaScotlandSenegalSerbiaSierra LeoneSingaporeSomaliaSouth AfricaSouth AmericaSouth Central AsiaSouth Eastern AsiaSouthern EuropeSpainSri LankaSt. Vincent and the GrenadinesSudanSwedenSwitzerlandSyriaTaiwanThailandTrinidad and TobagoTurkeyUgandaUkraineUruguayUzbekistanVenezuelaVietnamWest IndiesWestern AfricaWestern AsiaWestern EuropeYemenZaireZimbabweAzores
Hopi
Race
Ancestry
AfghanAfricanAlaska NativeAlaskan AthabascanAlbanianAleutAlsatianAmericanApacheArabArapahoArgentineanArmenianAssyrian/Chaldean/SyriacAustralianAustrianBahamianBangladeshiBarbadianBasqueBelgianBelizeanBermudanBhutaneseBlackfeetBolivianBrazilianBritishBritish West IndianBulgarianBurmeseCajunCambodianCanadianCape VerdeanCarpatho RusynCelticCentral AmericanCentral American IndianCherokeeCheyenneChickasawChileanChineseChippewaChoctawColombianColvilleComancheCosta RicanCreeCreekCroatianCrowCubanCypriotCzechCzechoslovakianDanishDelawareDominicanDutchDutch West IndianEastern EuropeanEcuadorianEgyptianEnglishEstonianEthiopianEuropeanFijianFilipinoFinnishFrenchFrench American IndianFrench CanadianGermanGerman RussianGhanaianGreekGuamanian/ChamorroGuatemalanGuyaneseHaitianHmongHonduranHopiHoumaHungarianIcelanderIndian (Asian)IndonesianInupiatIranianIraqiIrishIroquoisIsraeliItalianJamaicanJapaneseJordanianKenyanKiowaKoreanLaotianLatvianLebaneseLiberianLithuanianLumbeeLuxembourgerMacedonianMalaysianMalteseMarshalleseMenomineeMexicanMexican American IndianMongolianMoroccanNative HawaiianNavajoNepaleseNew ZealanderNicaraguanNigerianNorthern EuropeanNorwegianOkinawanOsageOttawaPaiutePakistaniPalestinianPanamanianParaguayanPennsylvania GermanPeruvianPimaPolishPortuguesePotawatomiPuebloPuerto RicanPuget Sound SalishRomanianRussianSalvadoranSamoanScandinavianScotch-IrishScottishSeminoleSenegaleseSerbianShoshoneSierra LeoneanSiouxSlavicSlovakSloveneSomaliSouth AfricanSouth AmericanSouth American IndianSoviet UnionSpaniardSpanishSpanish AmericanSpanish American IndianSri LankanSubsaharan AfricanSudaneseSwedishSwissSyrianTaiwaneseThaiTlingit-HaidaTohono O'OdhamTonganTrinidadian and TobagonianTsimshianTurkishU.S. Virgin IslanderUgandanUkrainianUruguayanUteVenezuelanVietnameseWelshWest IndianYakamaYugoslavianYumanYup'ikZimbabwean
Immigration
NonimmigrantsImmigrantsAfghanistanAfricaAlbaniaArgentinaArmeniaAsiaAustraliaAustriaBahamasBangladeshBarbadosBelarusBelgiumBelizeBoliviaBosnia and HerzegovinaBrazilBulgariaBurma/MyanmarCabo VerdeCambodiaCameroonCanadaCaribbeanCentral AmericaChileChinaColombiaCongoCosta RicaCroatiaCubaCzechoslovakiaDenmarkDominicaDominican RepublicEastern AfricaEastern AsiaEastern EuropeEcuadorEgyptEl SalvadorEnglandEritreaEthiopiaEuropeFijiFranceGermanyGhanaGreeceGrenadaGuatemalaGuyanaHaitiHondurasHong KongHungaryIndiaIndonesiaIranIraqIrelandIsraelItalyJamaicaJapanJordanKazakhstanKenyaKoreaKuwaitLaosLatin AmericaLatviaLebanonLiberiaLithuaniaMalaysiaMexicoMicronesiaMiddle AfricaMoldovaMoroccoNepalNetherlandsNicaraguaNigeriaNorth AmericaNorth MacedoniaNorthern AfricaNorthern EuropeNorwayOceaniaPakistanPanamaPeruPhilippinesPolandPortugalRomaniaRussiaSaudi ArabiaScotlandSenegalSerbiaSierra LeoneSingaporeSomaliaSouth AfricaSouth AmericaSouth Central AsiaSouth Eastern AsiaSouthern EuropeSpainSri LankaSt. Vincent and the GrenadinesSudanSwedenSwitzerlandSyriaTaiwanThailandTrinidad and TobagoTurkeyUgandaUkraineUruguayUzbekistanVenezuelaVietnamWest IndiesWestern AfricaWestern AsiaWestern EuropeYemenZaireZimbabweAzores
In Labor Force | Age 20-24
Income
Poverty
Unemployment
Labor Participation
Family Structure
Vehicle Availability
Education Level
Disability

In Labor Force | Age 20-24 Comparison

Yaqui

Hopi

Excellent
Tragic
75.5%
IN LABOR FORCE | AGE 20-24
85.5/ 100
METRIC RATING
135th/ 347
METRIC RANK
66.0%
IN LABOR FORCE | AGE 20-24
0.0/ 100
METRIC RATING
345th/ 347
METRIC RANK

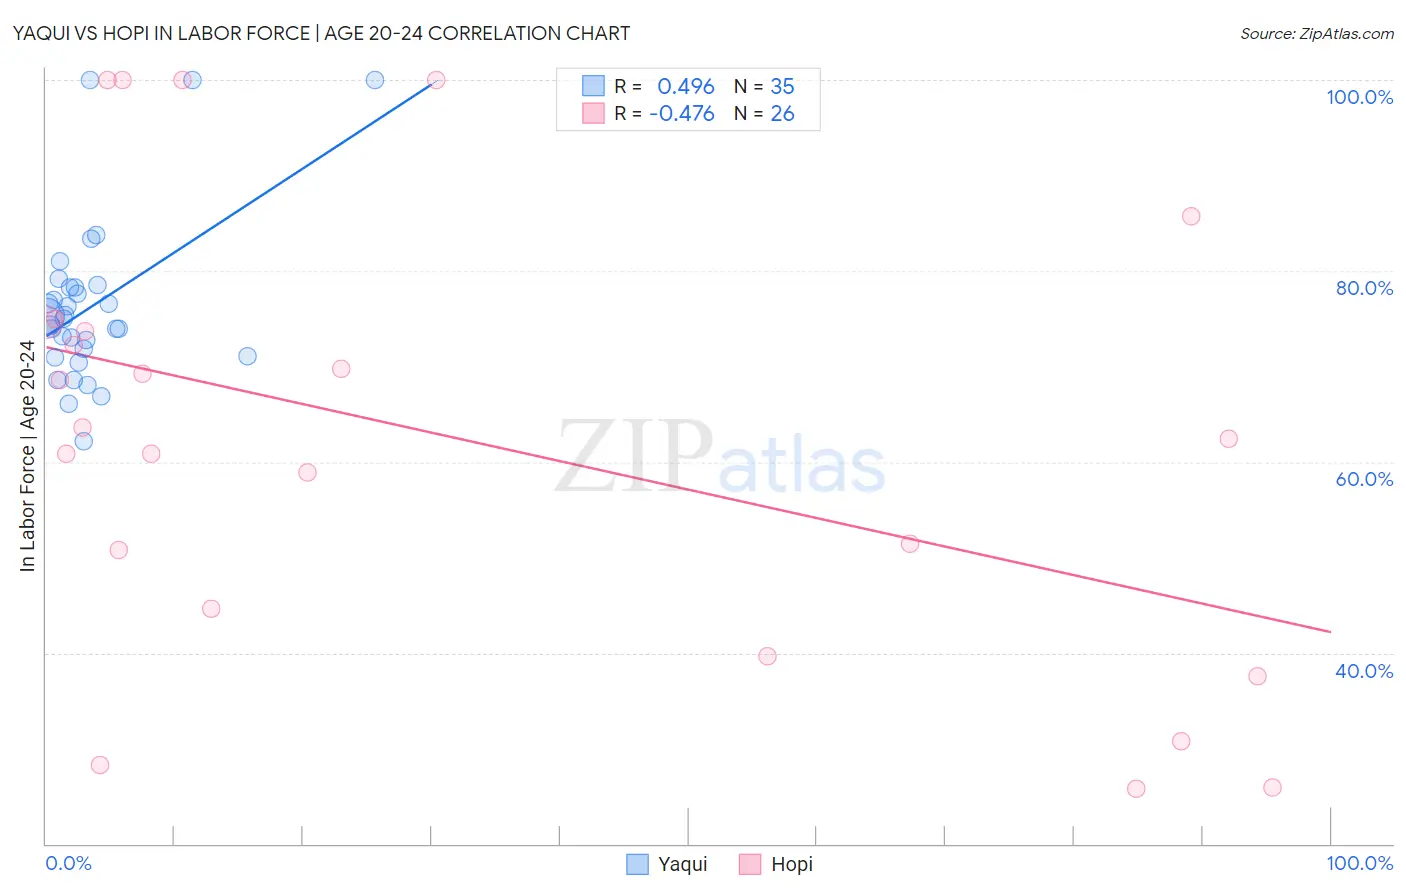
Yaqui vs Hopi In Labor Force | Age 20-24 Correlation Chart

The statistical analysis conducted on geographies consisting of 107,696,934 people shows a moderate positive correlation between the proportion of Yaqui and labor force participation rate among population between the ages 20 and 24 in the United States with a correlation coefficient (R) of 0.496 and weighted average of 75.5%. Similarly, the statistical analysis conducted on geographies consisting of 74,726,569 people shows a moderate negative correlation between the proportion of Hopi and labor force participation rate among population between the ages 20 and 24 in the United States with a correlation coefficient (R) of -0.476 and weighted average of 66.0%, a difference of 14.4%.
Yaqui vs Hopi In Labor Force | Age 20-24

In Labor Force | Age 20-24 Correlation Summary

MeasurementYaquiHopi
Minimum62.2%25.7%
Maximum100.0%100.0%
Range37.8%74.3%
Mean76.3%62.7%
Median75.1%63.0%
Interquartile 25% (IQ1)71.0%44.6%
Interquartile 75% (IQ3)78.3%74.6%
Interquartile Range (IQR)7.3%30.0%
Standard Deviation (Sample)8.7%23.2%
Standard Deviation (Population)8.6%22.7%

Similar Demographics by In Labor Force | Age 20-24

Demographics Similar to Yaqui by In Labor Force | Age 20-24

In terms of in labor force | age 20-24, the demographic groups most similar to Yaqui are Immigrants from Brazil (75.5%, a difference of 0.020%), Jordanian (75.5%, a difference of 0.020%), Australian (75.5%, a difference of 0.020%), Immigrants from England (75.5%, a difference of 0.030%), and Delaware (75.5%, a difference of 0.030%).
DemographicsRating | RankIn Labor Force | Age 20-24
Immigrants | Afghanistan
89.4
/100
|
#128
Excellent
75.6%
Iroquois
89.1
/100
|
#129
Excellent
75.6%
Immigrants | Austria
88.8
/100
|
#130
Excellent
75.6%
Immigrants | Jordan
88.5
/100
|
#131
Excellent
75.6%
Palestinians
88.4
/100
|
#132
Excellent
75.6%
Zimbabweans
88.2
/100
|
#133
Excellent
75.6%
Estonians
87.1
/100
|
#134
Excellent
75.6%
Yaqui
85.5
/100
|
#135
Excellent
75.5%
Immigrants | Brazil
84.8
/100
|
#136
Excellent
75.5%
Jordanians
84.8
/100
|
#137
Excellent
75.5%
Australians
84.8
/100
|
#138
Excellent
75.5%
Immigrants | England
84.6
/100
|
#139
Excellent
75.5%
Delaware
84.5
/100
|
#140
Excellent
75.5%
Romanians
84.1
/100
|
#141
Excellent
75.5%
Blackfeet
83.6
/100
|
#142
Excellent
75.5%

Demographics Similar to Hopi by In Labor Force | Age 20-24

In terms of in labor force | age 20-24, the demographic groups most similar to Hopi are Lumbee (65.5%, a difference of 0.79%), Immigrants from Grenada (67.2%, a difference of 1.7%), Navajo (64.8%, a difference of 1.8%), Puerto Rican (68.3%, a difference of 3.5%), and Immigrants from St. Vincent and the Grenadines (68.4%, a difference of 3.6%).
DemographicsRating | RankIn Labor Force | Age 20-24
Yuman
0.0
/100
|
#333
Tragic
70.3%
British West Indians
0.0
/100
|
#334
Tragic
70.0%
Immigrants | Barbados
0.0
/100
|
#335
Tragic
69.7%
Immigrants | Guyana
0.0
/100
|
#336
Tragic
69.3%
Guyanese
0.0
/100
|
#337
Tragic
69.2%
Pima
0.0
/100
|
#338
Tragic
69.0%
Immigrants | Yemen
0.0
/100
|
#339
Tragic
68.9%
Menominee
0.0
/100
|
#340
Tragic
68.7%
Tohono O'odham
0.0
/100
|
#341
Tragic
68.6%
Immigrants | St. Vincent and the Grenadines
0.0
/100
|
#342
Tragic
68.4%
Puerto Ricans
0.0
/100
|
#343
Tragic
68.3%
Immigrants | Grenada
0.0
/100
|
#344
Tragic
67.2%
Hopi
0.0
/100
|
#345
Tragic
66.0%
Lumbee
0.0
/100
|
#346
Tragic
65.5%
Navajo
0.0
/100
|
#347
Tragic
64.8%