Yakama vs Immigrants from Norway In Labor Force | Age 16-19

COMPARE

Yakama
Race
Ancestry
AfghanAfricanAlaska NativeAlaskan AthabascanAlbanianAleutAlsatianAmericanApacheArabArapahoArgentineanArmenianAssyrian/Chaldean/SyriacAustralianAustrianBahamianBangladeshiBarbadianBasqueBelgianBelizeanBermudanBhutaneseBlackfeetBolivianBrazilianBritishBritish West IndianBulgarianBurmeseCajunCambodianCanadianCape VerdeanCarpatho RusynCelticCentral AmericanCentral American IndianCherokeeCheyenneChickasawChileanChineseChippewaChoctawColombianColvilleComancheCosta RicanCreeCreekCroatianCrowCubanCypriotCzechCzechoslovakianDanishDelawareDominicanDutchDutch West IndianEastern EuropeanEcuadorianEgyptianEnglishEstonianEthiopianEuropeanFijianFilipinoFinnishFrenchFrench American IndianFrench CanadianGermanGerman RussianGhanaianGreekGuamanian/ChamorroGuatemalanGuyaneseHaitianHmongHonduranHopiHoumaHungarianIcelanderIndian (Asian)IndonesianInupiatIranianIraqiIrishIroquoisIsraeliItalianJamaicanJapaneseJordanianKenyanKiowaKoreanLaotianLatvianLebaneseLiberianLithuanianLumbeeLuxembourgerMacedonianMalaysianMalteseMarshalleseMenomineeMexicanMexican American IndianMongolianMoroccanNative HawaiianNavajoNepaleseNew ZealanderNicaraguanNigerianNorthern EuropeanNorwegianOkinawanOsageOttawaPaiutePakistaniPalestinianPanamanianParaguayanPennsylvania GermanPeruvianPimaPolishPortuguesePotawatomiPuebloPuerto RicanPuget Sound SalishRomanianRussianSalvadoranSamoanScandinavianScotch-IrishScottishSeminoleSenegaleseSerbianShoshoneSierra LeoneanSiouxSlavicSlovakSloveneSomaliSouth AfricanSouth AmericanSouth American IndianSoviet UnionSpaniardSpanishSpanish AmericanSpanish American IndianSri LankanSubsaharan AfricanSudaneseSwedishSwissSyrianTaiwaneseThaiTlingit-HaidaTohono O'OdhamTonganTrinidadian and TobagonianTsimshianTurkishU.S. Virgin IslanderUgandanUkrainianUruguayanUteVenezuelanVietnameseWelshWest IndianYakamaYaquiYugoslavianYumanYup'ikZimbabwean
Immigration
NonimmigrantsImmigrantsAfghanistanAfricaAlbaniaArgentinaArmeniaAsiaAustraliaAustriaBahamasBangladeshBarbadosBelarusBelgiumBelizeBoliviaBosnia and HerzegovinaBrazilBulgariaBurma/MyanmarCabo VerdeCambodiaCameroonCanadaCaribbeanCentral AmericaChileChinaColombiaCongoCosta RicaCroatiaCubaCzechoslovakiaDenmarkDominicaDominican RepublicEastern AfricaEastern AsiaEastern EuropeEcuadorEgyptEl SalvadorEnglandEritreaEthiopiaEuropeFijiFranceGermanyGhanaGreeceGrenadaGuatemalaGuyanaHaitiHondurasHong KongHungaryIndiaIndonesiaIranIraqIrelandIsraelItalyJamaicaJapanJordanKazakhstanKenyaKoreaKuwaitLaosLatin AmericaLatviaLebanonLiberiaLithuaniaMalaysiaMexicoMicronesiaMiddle AfricaMoldovaMoroccoNepalNetherlandsNicaraguaNigeriaNorth AmericaNorth MacedoniaNorthern AfricaNorthern EuropeOceaniaPakistanPanamaPeruPhilippinesPolandPortugalRomaniaRussiaSaudi ArabiaScotlandSenegalSerbiaSierra LeoneSingaporeSomaliaSouth AfricaSouth AmericaSouth Central AsiaSouth Eastern AsiaSouthern EuropeSpainSri LankaSt. Vincent and the GrenadinesSudanSwedenSwitzerlandSyriaTaiwanThailandTrinidad and TobagoTurkeyUgandaUkraineUruguayUzbekistanVenezuelaVietnamWest IndiesWestern AfricaWestern AsiaWestern EuropeYemenZaireZimbabweAzores
Immigrants from Norway
Race
Ancestry
AfghanAfricanAlaska NativeAlaskan AthabascanAlbanianAleutAlsatianAmericanApacheArabArapahoArgentineanArmenianAssyrian/Chaldean/SyriacAustralianAustrianBahamianBangladeshiBarbadianBasqueBelgianBelizeanBermudanBhutaneseBlackfeetBolivianBrazilianBritishBritish West IndianBulgarianBurmeseCajunCambodianCanadianCape VerdeanCarpatho RusynCelticCentral AmericanCentral American IndianCherokeeCheyenneChickasawChileanChineseChippewaChoctawColombianColvilleComancheCosta RicanCreeCreekCroatianCrowCubanCypriotCzechCzechoslovakianDanishDelawareDominicanDutchDutch West IndianEastern EuropeanEcuadorianEgyptianEnglishEstonianEthiopianEuropeanFijianFilipinoFinnishFrenchFrench American IndianFrench CanadianGermanGerman RussianGhanaianGreekGuamanian/ChamorroGuatemalanGuyaneseHaitianHmongHonduranHopiHoumaHungarianIcelanderIndian (Asian)IndonesianInupiatIranianIraqiIrishIroquoisIsraeliItalianJamaicanJapaneseJordanianKenyanKiowaKoreanLaotianLatvianLebaneseLiberianLithuanianLumbeeLuxembourgerMacedonianMalaysianMalteseMarshalleseMenomineeMexicanMexican American IndianMongolianMoroccanNative HawaiianNavajoNepaleseNew ZealanderNicaraguanNigerianNorthern EuropeanNorwegianOkinawanOsageOttawaPaiutePakistaniPalestinianPanamanianParaguayanPennsylvania GermanPeruvianPimaPolishPortuguesePotawatomiPuebloPuerto RicanPuget Sound SalishRomanianRussianSalvadoranSamoanScandinavianScotch-IrishScottishSeminoleSenegaleseSerbianShoshoneSierra LeoneanSiouxSlavicSlovakSloveneSomaliSouth AfricanSouth AmericanSouth American IndianSoviet UnionSpaniardSpanishSpanish AmericanSpanish American IndianSri LankanSubsaharan AfricanSudaneseSwedishSwissSyrianTaiwaneseThaiTlingit-HaidaTohono O'OdhamTonganTrinidadian and TobagonianTsimshianTurkishU.S. Virgin IslanderUgandanUkrainianUruguayanUteVenezuelanVietnameseWelshWest IndianYaquiYugoslavianYumanYup'ikZimbabwean
Immigration
NonimmigrantsImmigrantsAfghanistanAfricaAlbaniaArgentinaArmeniaAsiaAustraliaAustriaBahamasBangladeshBarbadosBelarusBelgiumBelizeBoliviaBosnia and HerzegovinaBrazilBulgariaBurma/MyanmarCabo VerdeCambodiaCameroonCanadaCaribbeanCentral AmericaChileChinaColombiaCongoCosta RicaCroatiaCubaCzechoslovakiaDenmarkDominicaDominican RepublicEastern AfricaEastern AsiaEastern EuropeEcuadorEgyptEl SalvadorEnglandEritreaEthiopiaEuropeFijiFranceGermanyGhanaGreeceGrenadaGuatemalaGuyanaHaitiHondurasHong KongHungaryIndiaIndonesiaIranIraqIrelandIsraelItalyJamaicaJapanJordanKazakhstanKenyaKoreaKuwaitLaosLatin AmericaLatviaLebanonLiberiaLithuaniaMalaysiaMexicoMicronesiaMiddle AfricaMoldovaMoroccoNepalNetherlandsNicaraguaNigeriaNorth AmericaNorth MacedoniaNorthern AfricaNorthern EuropeNorwayOceaniaPakistanPanamaPeruPhilippinesPolandPortugalRomaniaRussiaSaudi ArabiaScotlandSenegalSerbiaSierra LeoneSingaporeSomaliaSouth AfricaSouth AmericaSouth Central AsiaSouth Eastern AsiaSouthern EuropeSpainSri LankaSt. Vincent and the GrenadinesSudanSwedenSwitzerlandSyriaTaiwanThailandTrinidad and TobagoTurkeyUgandaUkraineUruguayUzbekistanVenezuelaVietnamWest IndiesWestern AfricaWestern AsiaWestern EuropeYemenZaireZimbabweAzores
In Labor Force | Age 16-19
Income
Poverty
Unemployment
Labor Participation
Family Structure
Vehicle Availability
Education Level
Disability

In Labor Force | Age 16-19 Comparison

Yakama

Immigrants from Norway

Good
Poor
36.9%
IN LABOR FORCE | AGE 16-19
66.9/ 100
METRIC RATING
165th/ 347
METRIC RANK
35.9%
IN LABOR FORCE | AGE 16-19
19.8/ 100
METRIC RATING
199th/ 347
METRIC RANK

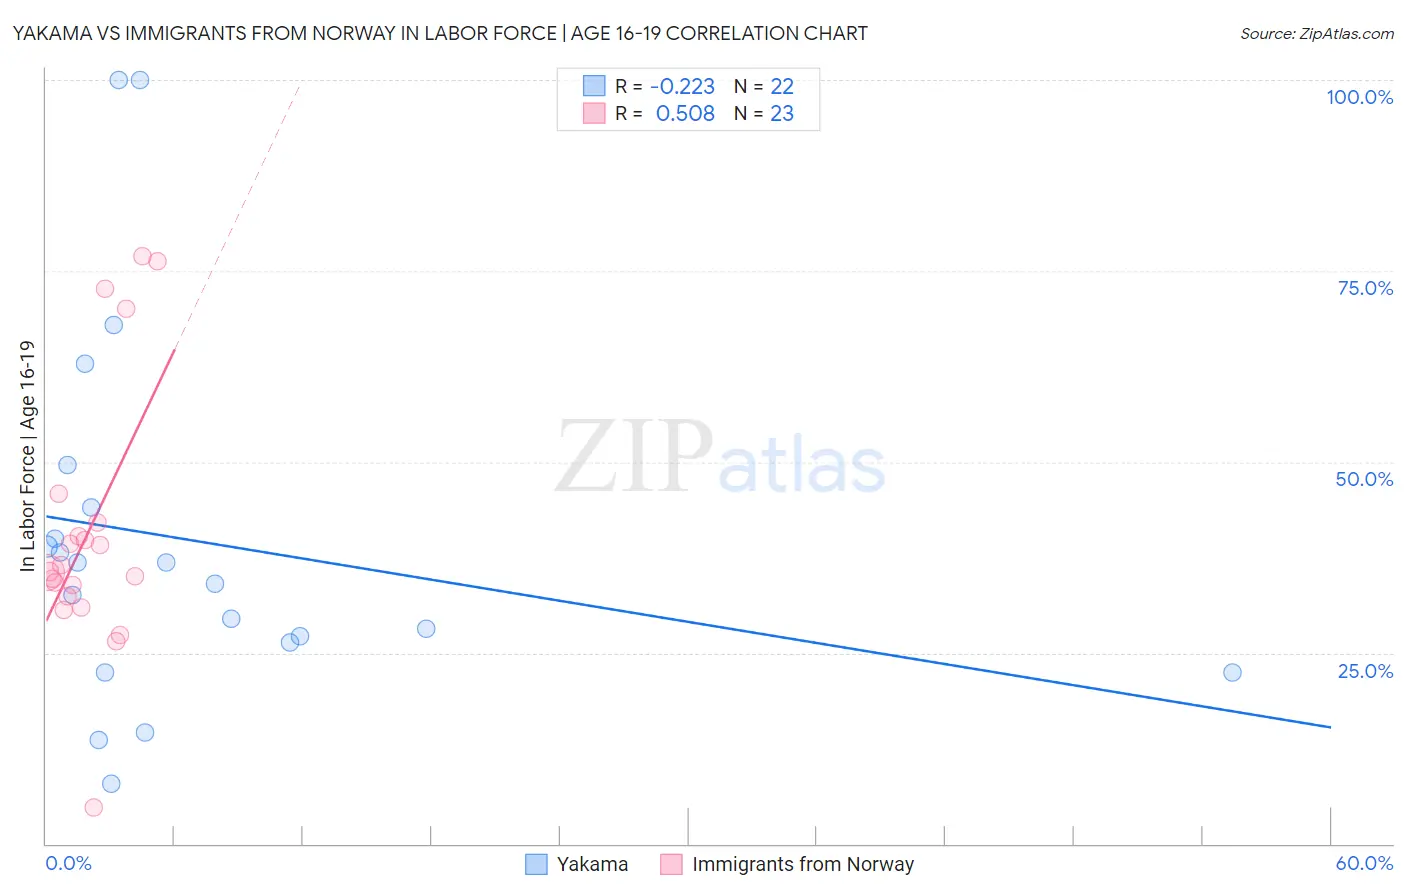
Yakama vs Immigrants from Norway In Labor Force | Age 16-19 Correlation Chart

The statistical analysis conducted on geographies consisting of 19,894,194 people shows a weak negative correlation between the proportion of Yakama and labor force participation rate among population between the ages 16 and 19 in the United States with a correlation coefficient (R) of -0.223 and weighted average of 36.9%. Similarly, the statistical analysis conducted on geographies consisting of 116,617,950 people shows a substantial positive correlation between the proportion of Immigrants from Norway and labor force participation rate among population between the ages 16 and 19 in the United States with a correlation coefficient (R) of 0.508 and weighted average of 35.9%, a difference of 2.7%.
Yakama vs Immigrants from Norway In Labor Force | Age 16-19

In Labor Force | Age 16-19 Correlation Summary

MeasurementYakamaImmigrants from Norway
Minimum7.9%4.7%
Maximum100.0%76.9%
Range92.1%72.2%
Mean39.7%40.9%
Median35.4%35.6%
Interquartile 25% (IQ1)26.4%32.4%
Interquartile 75% (IQ3)44.0%42.0%
Interquartile Range (IQR)17.6%9.6%
Standard Deviation (Sample)24.2%17.4%
Standard Deviation (Population)23.7%17.0%

Similar Demographics by In Labor Force | Age 16-19

Demographics Similar to Yakama by In Labor Force | Age 16-19

In terms of in labor force | age 16-19, the demographic groups most similar to Yakama are Immigrants from Western Africa (36.9%, a difference of 0.010%), Immigrants from Kuwait (36.9%, a difference of 0.11%), Bermudan (36.9%, a difference of 0.14%), Immigrants from Jordan (36.9%, a difference of 0.15%), and Arab (36.8%, a difference of 0.18%).
DemographicsRating | RankIn Labor Force | Age 16-19
Ute
75.7
/100
|
#158
Good
37.1%
Yaqui
74.4
/100
|
#159
Good
37.1%
Immigrants | Saudi Arabia
73.9
/100
|
#160
Good
37.0%
Cambodians
71.5
/100
|
#161
Good
37.0%
Immigrants | Jordan
69.5
/100
|
#162
Good
36.9%
Bermudans
69.3
/100
|
#163
Good
36.9%
Immigrants | Kuwait
68.9
/100
|
#164
Good
36.9%
Yakama
66.9
/100
|
#165
Good
36.9%
Immigrants | Western Africa
66.7
/100
|
#166
Good
36.9%
Arabs
63.6
/100
|
#167
Good
36.8%
Palestinians
63.1
/100
|
#168
Good
36.8%
Immigrants | Latvia
61.6
/100
|
#169
Good
36.8%
Immigrants | South Africa
60.5
/100
|
#170
Good
36.8%
Immigrants | Cambodia
58.4
/100
|
#171
Average
36.7%
South Africans
58.3
/100
|
#172
Average
36.7%

Demographics Similar to Immigrants from Norway by In Labor Force | Age 16-19

In terms of in labor force | age 16-19, the demographic groups most similar to Immigrants from Norway are Immigrants from Northern Africa (35.9%, a difference of 0.010%), Immigrants from Sweden (35.9%, a difference of 0.080%), Immigrants from Serbia (36.0%, a difference of 0.090%), Mexican American Indian (36.0%, a difference of 0.10%), and Alsatian (35.9%, a difference of 0.19%).
DemographicsRating | RankIn Labor Force | Age 16-19
Afghans
25.7
/100
|
#192
Fair
36.1%
Immigrants | Denmark
25.0
/100
|
#193
Fair
36.1%
Nigerians
24.6
/100
|
#194
Fair
36.1%
Bolivians
23.3
/100
|
#195
Fair
36.0%
Mexican American Indians
21.1
/100
|
#196
Fair
36.0%
Immigrants | Serbia
21.0
/100
|
#197
Fair
36.0%
Immigrants | Northern Africa
19.9
/100
|
#198
Poor
35.9%
Immigrants | Norway
19.8
/100
|
#199
Poor
35.9%
Immigrants | Sweden
18.8
/100
|
#200
Poor
35.9%
Alsatians
17.5
/100
|
#201
Poor
35.9%
Senegalese
17.4
/100
|
#202
Poor
35.9%
Immigrants | Nigeria
16.8
/100
|
#203
Poor
35.8%
Immigrants | Albania
15.0
/100
|
#204
Poor
35.8%
South American Indians
14.6
/100
|
#205
Poor
35.8%
Chileans
14.6
/100
|
#206
Poor
35.8%