West Indian vs Immigrants from Central America In Labor Force | Age 25-29
COMPARE
West Indian
Immigrants from Central America
In Labor Force | Age 25-29
In Labor Force | Age 25-29 Comparison
West Indians
Immigrants from Central America
83.5%
IN LABOR FORCE | AGE 25-29
0.1/ 100
METRIC RATING
263rd/ 347
METRIC RANK
82.4%
IN LABOR FORCE | AGE 25-29
0.0/ 100
METRIC RATING
309th/ 347
METRIC RANK
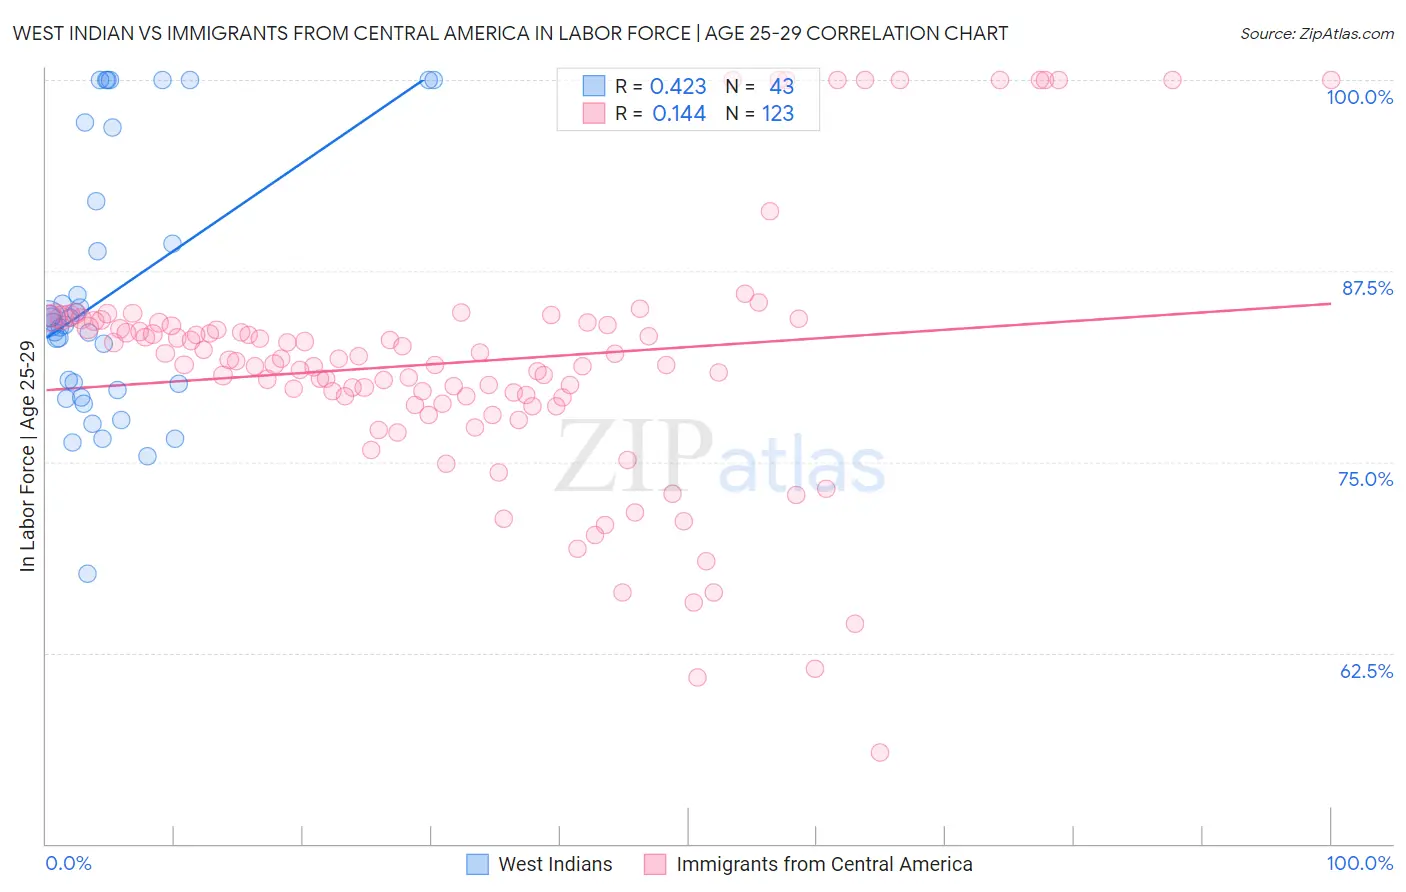
West Indian vs Immigrants from Central America In Labor Force | Age 25-29 Correlation Chart
The statistical analysis conducted on geographies consisting of 254,002,174 people shows a moderate positive correlation between the proportion of West Indians and labor force participation rate among population between the ages 25 and 29 in the United States with a correlation coefficient (R) of 0.423 and weighted average of 83.5%. Similarly, the statistical analysis conducted on geographies consisting of 535,870,907 people shows a poor positive correlation between the proportion of Immigrants from Central America and labor force participation rate among population between the ages 25 and 29 in the United States with a correlation coefficient (R) of 0.144 and weighted average of 82.4%, a difference of 1.3%.
In Labor Force | Age 25-29 Correlation Summary
| Measurement | West Indian | Immigrants from Central America |
| Minimum | 67.7% | 56.0% |
| Maximum | 100.0% | 100.0% |
| Range | 32.3% | 44.0% |
| Mean | 86.0% | 81.5% |
| Median | 84.2% | 81.6% |
| Interquartile 25% (IQ1) | 79.7% | 78.8% |
| Interquartile 75% (IQ3) | 92.1% | 84.1% |
| Interquartile Range (IQR) | 12.4% | 5.3% |
| Standard Deviation (Sample) | 8.6% | 8.3% |
| Standard Deviation (Population) | 8.5% | 8.2% |
Similar Demographics by In Labor Force | Age 25-29
Demographics Similar to West Indians by In Labor Force | Age 25-29
In terms of in labor force | age 25-29, the demographic groups most similar to West Indians are Immigrants from Fiji (83.6%, a difference of 0.040%), Puget Sound Salish (83.5%, a difference of 0.060%), Cuban (83.5%, a difference of 0.060%), Aleut (83.4%, a difference of 0.10%), and Immigrants from Bahamas (83.6%, a difference of 0.11%).
| Demographics | Rating | Rank | In Labor Force | Age 25-29 |
| Immigrants | Haiti | 0.2 /100 | #256 | Tragic 83.7% |
| Delaware | 0.2 /100 | #257 | Tragic 83.7% |
| Immigrants | Guatemala | 0.1 /100 | #258 | Tragic 83.6% |
| Spanish | 0.1 /100 | #259 | Tragic 83.6% |
| Immigrants | Bahamas | 0.1 /100 | #260 | Tragic 83.6% |
| Pennsylvania Germans | 0.1 /100 | #261 | Tragic 83.6% |
| Immigrants | Fiji | 0.1 /100 | #262 | Tragic 83.6% |
| West Indians | 0.1 /100 | #263 | Tragic 83.5% |
| Puget Sound Salish | 0.1 /100 | #264 | Tragic 83.5% |
| Cubans | 0.1 /100 | #265 | Tragic 83.5% |
| Aleuts | 0.0 /100 | #266 | Tragic 83.4% |
| Spanish Americans | 0.0 /100 | #267 | Tragic 83.4% |
| Immigrants | Lebanon | 0.0 /100 | #268 | Tragic 83.4% |
| Immigrants | Barbados | 0.0 /100 | #269 | Tragic 83.4% |
| Basques | 0.0 /100 | #270 | Tragic 83.4% |
Demographics Similar to Immigrants from Central America by In Labor Force | Age 25-29
In terms of in labor force | age 25-29, the demographic groups most similar to Immigrants from Central America are Central American Indian (82.4%, a difference of 0.010%), Osage (82.3%, a difference of 0.14%), Alaskan Athabascan (82.3%, a difference of 0.15%), Cajun (82.5%, a difference of 0.16%), and Hispanic or Latino (82.2%, a difference of 0.21%).
| Demographics | Rating | Rank | In Labor Force | Age 25-29 |
| Immigrants | Belize | 0.0 /100 | #302 | Tragic 82.8% |
| Immigrants | Grenada | 0.0 /100 | #303 | Tragic 82.8% |
| Immigrants | St. Vincent and the Grenadines | 0.0 /100 | #304 | Tragic 82.7% |
| Blacks/African Americans | 0.0 /100 | #305 | Tragic 82.6% |
| Blackfeet | 0.0 /100 | #306 | Tragic 82.6% |
| Cajuns | 0.0 /100 | #307 | Tragic 82.5% |
| Central American Indians | 0.0 /100 | #308 | Tragic 82.4% |
| Immigrants | Central America | 0.0 /100 | #309 | Tragic 82.4% |
| Osage | 0.0 /100 | #310 | Tragic 82.3% |
| Alaskan Athabascans | 0.0 /100 | #311 | Tragic 82.3% |
| Hispanics or Latinos | 0.0 /100 | #312 | Tragic 82.2% |
| Yaqui | 0.0 /100 | #313 | Tragic 82.2% |
| Cherokee | 0.0 /100 | #314 | Tragic 82.1% |
| Immigrants | Mexico | 0.0 /100 | #315 | Tragic 82.0% |
| Mexicans | 0.0 /100 | #316 | Tragic 81.9% |