U.S. Virgin Islander vs Immigrants from Guatemala In Labor Force | Age 16-19

COMPARE

U.S. Virgin Islander
Race
Ancestry
AfghanAfricanAlaska NativeAlaskan AthabascanAlbanianAleutAlsatianAmericanApacheArabArapahoArgentineanArmenianAssyrian/Chaldean/SyriacAustralianAustrianBahamianBangladeshiBarbadianBasqueBelgianBelizeanBermudanBhutaneseBlackfeetBolivianBrazilianBritishBritish West IndianBulgarianBurmeseCajunCambodianCanadianCape VerdeanCarpatho RusynCelticCentral AmericanCentral American IndianCherokeeCheyenneChickasawChileanChineseChippewaChoctawColombianColvilleComancheCosta RicanCreeCreekCroatianCrowCubanCypriotCzechCzechoslovakianDanishDelawareDominicanDutchDutch West IndianEastern EuropeanEcuadorianEgyptianEnglishEstonianEthiopianEuropeanFijianFilipinoFinnishFrenchFrench American IndianFrench CanadianGermanGerman RussianGhanaianGreekGuamanian/ChamorroGuatemalanGuyaneseHaitianHmongHonduranHopiHoumaHungarianIcelanderIndian (Asian)IndonesianInupiatIranianIraqiIrishIroquoisIsraeliItalianJamaicanJapaneseJordanianKenyanKiowaKoreanLaotianLatvianLebaneseLiberianLithuanianLumbeeLuxembourgerMacedonianMalaysianMalteseMarshalleseMenomineeMexicanMexican American IndianMongolianMoroccanNative HawaiianNavajoNepaleseNew ZealanderNicaraguanNigerianNorthern EuropeanNorwegianOkinawanOsageOttawaPaiutePakistaniPalestinianPanamanianParaguayanPennsylvania GermanPeruvianPimaPolishPortuguesePotawatomiPuebloPuerto RicanPuget Sound SalishRomanianRussianSalvadoranSamoanScandinavianScotch-IrishScottishSeminoleSenegaleseSerbianShoshoneSierra LeoneanSiouxSlavicSlovakSloveneSomaliSouth AfricanSouth AmericanSouth American IndianSoviet UnionSpaniardSpanishSpanish AmericanSpanish American IndianSri LankanSubsaharan AfricanSudaneseSwedishSwissSyrianTaiwaneseThaiTlingit-HaidaTohono O'OdhamTonganTrinidadian and TobagonianTsimshianTurkishU.S. Virgin IslanderUgandanUkrainianUruguayanUteVenezuelanVietnameseWelshWest IndianYakamaYaquiYugoslavianYumanYup'ikZimbabwean
Immigration
NonimmigrantsImmigrantsAfghanistanAfricaAlbaniaArgentinaArmeniaAsiaAustraliaAustriaBahamasBangladeshBarbadosBelarusBelgiumBelizeBoliviaBosnia and HerzegovinaBrazilBulgariaBurma/MyanmarCabo VerdeCambodiaCameroonCanadaCaribbeanCentral AmericaChileChinaColombiaCongoCosta RicaCroatiaCubaCzechoslovakiaDenmarkDominicaDominican RepublicEastern AfricaEastern AsiaEastern EuropeEcuadorEgyptEl SalvadorEnglandEritreaEthiopiaEuropeFijiFranceGermanyGhanaGreeceGrenadaGuyanaHaitiHondurasHong KongHungaryIndiaIndonesiaIranIraqIrelandIsraelItalyJamaicaJapanJordanKazakhstanKenyaKoreaKuwaitLaosLatin AmericaLatviaLebanonLiberiaLithuaniaMalaysiaMexicoMicronesiaMiddle AfricaMoldovaMoroccoNepalNetherlandsNicaraguaNigeriaNorth AmericaNorth MacedoniaNorthern AfricaNorthern EuropeNorwayOceaniaPakistanPanamaPeruPhilippinesPolandPortugalRomaniaRussiaSaudi ArabiaScotlandSenegalSerbiaSierra LeoneSingaporeSomaliaSouth AfricaSouth AmericaSouth Central AsiaSouth Eastern AsiaSouthern EuropeSpainSri LankaSt. Vincent and the GrenadinesSudanSwedenSwitzerlandSyriaTaiwanThailandTrinidad and TobagoTurkeyUgandaUkraineUruguayUzbekistanVenezuelaVietnamWest IndiesWestern AfricaWestern AsiaWestern EuropeYemenZaireZimbabweAzores
Immigrants from Guatemala
Race
Ancestry
AfghanAfricanAlaska NativeAlaskan AthabascanAlbanianAleutAlsatianAmericanApacheArabArapahoArgentineanArmenianAssyrian/Chaldean/SyriacAustralianAustrianBahamianBangladeshiBarbadianBasqueBelgianBelizeanBermudanBhutaneseBlackfeetBolivianBrazilianBritishBritish West IndianBulgarianBurmeseCajunCambodianCanadianCape VerdeanCarpatho RusynCelticCentral AmericanCentral American IndianCherokeeCheyenneChickasawChileanChineseChippewaChoctawColombianColvilleComancheCosta RicanCreeCreekCroatianCrowCubanCypriotCzechCzechoslovakianDanishDelawareDominicanDutchDutch West IndianEastern EuropeanEcuadorianEgyptianEnglishEstonianEthiopianEuropeanFijianFilipinoFinnishFrenchFrench American IndianFrench CanadianGermanGerman RussianGhanaianGreekGuamanian/ChamorroGuatemalanGuyaneseHaitianHmongHonduranHopiHoumaHungarianIcelanderIndian (Asian)IndonesianInupiatIranianIraqiIrishIroquoisIsraeliItalianJamaicanJapaneseJordanianKenyanKiowaKoreanLaotianLatvianLebaneseLiberianLithuanianLumbeeLuxembourgerMacedonianMalaysianMalteseMarshalleseMenomineeMexicanMexican American IndianMongolianMoroccanNative HawaiianNavajoNepaleseNew ZealanderNicaraguanNigerianNorthern EuropeanNorwegianOkinawanOsageOttawaPaiutePakistaniPalestinianPanamanianParaguayanPennsylvania GermanPeruvianPimaPolishPortuguesePotawatomiPuebloPuerto RicanPuget Sound SalishRomanianRussianSalvadoranSamoanScandinavianScotch-IrishScottishSeminoleSenegaleseSerbianShoshoneSierra LeoneanSiouxSlavicSlovakSloveneSomaliSouth AfricanSouth AmericanSouth American IndianSoviet UnionSpaniardSpanishSpanish AmericanSpanish American IndianSri LankanSubsaharan AfricanSudaneseSwedishSwissSyrianTaiwaneseThaiTlingit-HaidaTohono O'OdhamTonganTrinidadian and TobagonianTsimshianTurkishUgandanUkrainianUruguayanUteVenezuelanVietnameseWelshWest IndianYakamaYaquiYugoslavianYumanYup'ikZimbabwean
Immigration
NonimmigrantsImmigrantsAfghanistanAfricaAlbaniaArgentinaArmeniaAsiaAustraliaAustriaBahamasBangladeshBarbadosBelarusBelgiumBelizeBoliviaBosnia and HerzegovinaBrazilBulgariaBurma/MyanmarCabo VerdeCambodiaCameroonCanadaCaribbeanCentral AmericaChileChinaColombiaCongoCosta RicaCroatiaCubaCzechoslovakiaDenmarkDominicaDominican RepublicEastern AfricaEastern AsiaEastern EuropeEcuadorEgyptEl SalvadorEnglandEritreaEthiopiaEuropeFijiFranceGermanyGhanaGreeceGrenadaGuatemalaGuyanaHaitiHondurasHong KongHungaryIndiaIndonesiaIranIraqIrelandIsraelItalyJamaicaJapanJordanKazakhstanKenyaKoreaKuwaitLaosLatin AmericaLatviaLebanonLiberiaLithuaniaMalaysiaMexicoMicronesiaMiddle AfricaMoldovaMoroccoNepalNetherlandsNicaraguaNigeriaNorth AmericaNorth MacedoniaNorthern AfricaNorthern EuropeNorwayOceaniaPakistanPanamaPeruPhilippinesPolandPortugalRomaniaRussiaSaudi ArabiaScotlandSenegalSerbiaSierra LeoneSingaporeSomaliaSouth AfricaSouth AmericaSouth Central AsiaSouth Eastern AsiaSouthern EuropeSpainSri LankaSt. Vincent and the GrenadinesSudanSwedenSwitzerlandSyriaTaiwanThailandTrinidad and TobagoTurkeyUgandaUkraineUruguayUzbekistanVenezuelaVietnamWest IndiesWestern AfricaWestern AsiaWestern EuropeYemenZaireZimbabweAzores
In Labor Force | Age 16-19
Income
Poverty
Unemployment
Labor Participation
Family Structure
Vehicle Availability
Education Level
Disability

In Labor Force | Age 16-19 Comparison

U.S. Virgin Islanders

Immigrants from Guatemala

Tragic
Tragic
33.6%
IN LABOR FORCE | AGE 16-19
0.2/ 100
METRIC RATING
285th/ 347
METRIC RANK
35.3%
IN LABOR FORCE | AGE 16-19
5.7/ 100
METRIC RATING
226th/ 347
METRIC RANK

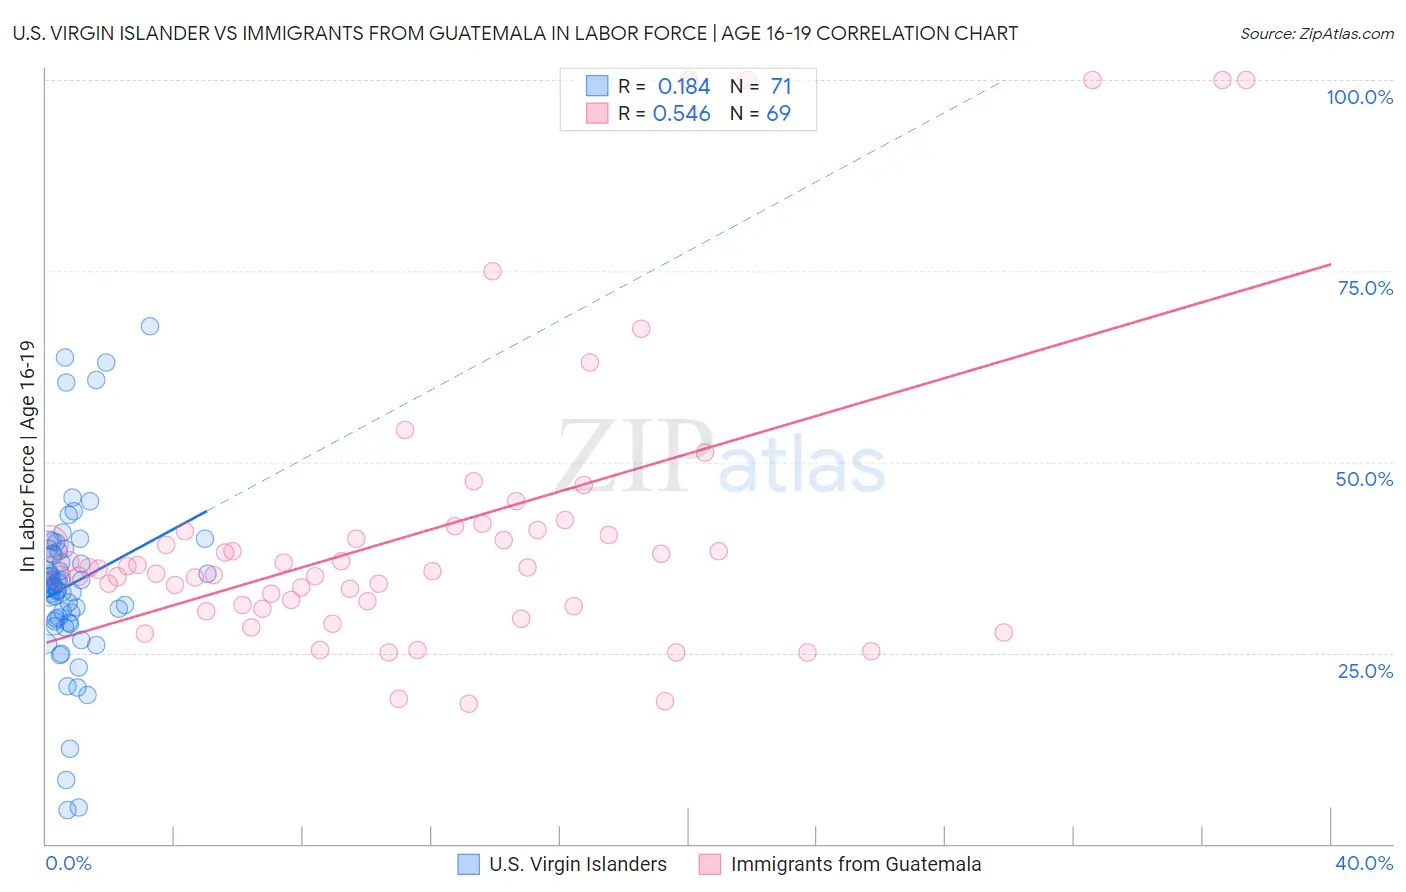
U.S. Virgin Islander vs Immigrants from Guatemala In Labor Force | Age 16-19 Correlation Chart

The statistical analysis conducted on geographies consisting of 87,491,211 people shows a poor positive correlation between the proportion of U.S. Virgin Islanders and labor force participation rate among population between the ages 16 and 19 in the United States with a correlation coefficient (R) of 0.184 and weighted average of 33.6%. Similarly, the statistical analysis conducted on geographies consisting of 376,894,090 people shows a substantial positive correlation between the proportion of Immigrants from Guatemala and labor force participation rate among population between the ages 16 and 19 in the United States with a correlation coefficient (R) of 0.546 and weighted average of 35.3%, a difference of 5.0%.
U.S. Virgin Islander vs Immigrants from Guatemala In Labor Force | Age 16-19

In Labor Force | Age 16-19 Correlation Summary

MeasurementU.S. Virgin IslanderImmigrants from Guatemala
Minimum4.4%18.3%
Maximum67.8%100.0%
Range63.4%81.7%
Mean34.0%40.9%
Median33.9%36.0%
Interquartile 25% (IQ1)29.1%31.1%
Interquartile 75% (IQ3)38.3%41.0%
Interquartile Range (IQR)9.2%9.8%
Standard Deviation (Sample)11.4%19.3%
Standard Deviation (Population)11.4%19.2%

Similar Demographics by In Labor Force | Age 16-19

Demographics Similar to U.S. Virgin Islanders by In Labor Force | Age 16-19

In terms of in labor force | age 16-19, the demographic groups most similar to U.S. Virgin Islanders are South American (33.6%, a difference of 0.080%), Immigrants from Spain (33.7%, a difference of 0.19%), Immigrants from Venezuela (33.7%, a difference of 0.25%), Nepalese (33.5%, a difference of 0.31%), and Immigrants from Indonesia (33.5%, a difference of 0.35%).
DemographicsRating | RankIn Labor Force | Age 16-19
Colombians
0.3
/100
|
#278
Tragic
33.8%
Paraguayans
0.3
/100
|
#279
Tragic
33.8%
Taiwanese
0.3
/100
|
#280
Tragic
33.8%
Cypriots
0.3
/100
|
#281
Tragic
33.8%
Immigrants | Korea
0.3
/100
|
#282
Tragic
33.8%
Immigrants | Venezuela
0.2
/100
|
#283
Tragic
33.7%
Immigrants | Spain
0.2
/100
|
#284
Tragic
33.7%
U.S. Virgin Islanders
0.2
/100
|
#285
Tragic
33.6%
South Americans
0.2
/100
|
#286
Tragic
33.6%
Nepalese
0.1
/100
|
#287
Tragic
33.5%
Immigrants | Indonesia
0.1
/100
|
#288
Tragic
33.5%
Immigrants | Singapore
0.1
/100
|
#289
Tragic
33.5%
Immigrants | Colombia
0.1
/100
|
#290
Tragic
33.5%
Immigrants | Belarus
0.1
/100
|
#291
Tragic
33.4%
Haitians
0.1
/100
|
#292
Tragic
33.4%

Demographics Similar to Immigrants from Guatemala by In Labor Force | Age 16-19

In terms of in labor force | age 16-19, the demographic groups most similar to Immigrants from Guatemala are Mongolian (35.3%, a difference of 0.010%), Immigrants from Senegal (35.3%, a difference of 0.060%), Immigrants from Belgium (35.3%, a difference of 0.090%), Honduran (35.3%, a difference of 0.17%), and Ghanaian (35.3%, a difference of 0.19%).
DemographicsRating | RankIn Labor Force | Age 16-19
Guatemalans
8.6
/100
|
#219
Tragic
35.5%
Immigrants | Bahamas
8.3
/100
|
#220
Tragic
35.5%
Turks
7.3
/100
|
#221
Tragic
35.4%
Immigrants | Ghana
7.3
/100
|
#222
Tragic
35.4%
Ghanaians
6.5
/100
|
#223
Tragic
35.3%
Hondurans
6.5
/100
|
#224
Tragic
35.3%
Immigrants | Belgium
6.1
/100
|
#225
Tragic
35.3%
Immigrants | Guatemala
5.7
/100
|
#226
Tragic
35.3%
Mongolians
5.7
/100
|
#227
Tragic
35.3%
Immigrants | Senegal
5.5
/100
|
#228
Tragic
35.3%
Immigrants | Lebanon
5.0
/100
|
#229
Tragic
35.2%
Immigrants | Honduras
4.9
/100
|
#230
Tragic
35.2%
Immigrants | Syria
4.5
/100
|
#231
Tragic
35.2%
Immigrants | Kazakhstan
4.5
/100
|
#232
Tragic
35.2%
Immigrants | France
4.3
/100
|
#233
Tragic
35.1%