Ugandan vs Hawaiian In Labor Force | Age 45-54

COMPARE

Ugandan
Race
Ancestry
AfghanAfricanAlaska NativeAlaskan AthabascanAlbanianAleutAlsatianAmericanApacheArabArapahoArgentineanArmenianAssyrian/Chaldean/SyriacAustralianAustrianBahamianBangladeshiBarbadianBasqueBelgianBelizeanBermudanBhutaneseBlackfeetBolivianBrazilianBritishBritish West IndianBulgarianBurmeseCajunCambodianCanadianCape VerdeanCarpatho RusynCelticCentral AmericanCentral American IndianCherokeeCheyenneChickasawChileanChineseChippewaChoctawColombianColvilleComancheCosta RicanCreeCreekCroatianCrowCubanCypriotCzechCzechoslovakianDanishDelawareDominicanDutchDutch West IndianEastern EuropeanEcuadorianEgyptianEnglishEstonianEthiopianEuropeanFijianFilipinoFinnishFrenchFrench American IndianFrench CanadianGermanGerman RussianGhanaianGreekGuamanian/ChamorroGuatemalanGuyaneseHaitianHmongHonduranHopiHoumaHungarianIcelanderIndian (Asian)IndonesianInupiatIranianIraqiIrishIroquoisIsraeliItalianJamaicanJapaneseJordanianKenyanKiowaKoreanLaotianLatvianLebaneseLiberianLithuanianLumbeeLuxembourgerMacedonianMalaysianMalteseMarshalleseMenomineeMexicanMexican American IndianMongolianMoroccanNative HawaiianNavajoNepaleseNew ZealanderNicaraguanNigerianNorthern EuropeanNorwegianOkinawanOsageOttawaPaiutePakistaniPalestinianPanamanianParaguayanPennsylvania GermanPeruvianPimaPolishPortuguesePotawatomiPuebloPuerto RicanPuget Sound SalishRomanianRussianSalvadoranSamoanScandinavianScotch-IrishScottishSeminoleSenegaleseSerbianShoshoneSierra LeoneanSiouxSlavicSlovakSloveneSomaliSouth AfricanSouth AmericanSouth American IndianSoviet UnionSpaniardSpanishSpanish AmericanSpanish American IndianSri LankanSubsaharan AfricanSudaneseSwedishSwissSyrianTaiwaneseThaiTlingit-HaidaTohono O'OdhamTonganTrinidadian and TobagonianTsimshianTurkishU.S. Virgin IslanderUgandanUkrainianUruguayanUteVenezuelanVietnameseWelshWest IndianYakamaYaquiYugoslavianYumanYup'ikZimbabwean
Immigration
NonimmigrantsImmigrantsAfghanistanAfricaAlbaniaArgentinaArmeniaAsiaAustraliaAustriaBahamasBangladeshBarbadosBelarusBelgiumBelizeBoliviaBosnia and HerzegovinaBrazilBulgariaBurma/MyanmarCabo VerdeCambodiaCameroonCanadaCaribbeanCentral AmericaChileChinaColombiaCongoCosta RicaCroatiaCubaCzechoslovakiaDenmarkDominicaDominican RepublicEastern AfricaEastern AsiaEastern EuropeEcuadorEgyptEl SalvadorEnglandEritreaEthiopiaEuropeFijiFranceGermanyGhanaGreeceGrenadaGuatemalaGuyanaHaitiHondurasHong KongHungaryIndiaIndonesiaIranIraqIrelandIsraelItalyJamaicaJapanJordanKazakhstanKenyaKoreaKuwaitLaosLatin AmericaLatviaLebanonLiberiaLithuaniaMalaysiaMexicoMicronesiaMiddle AfricaMoldovaMoroccoNepalNetherlandsNicaraguaNigeriaNorth AmericaNorth MacedoniaNorthern AfricaNorthern EuropeNorwayOceaniaPakistanPanamaPeruPhilippinesPolandPortugalRomaniaRussiaSaudi ArabiaScotlandSenegalSerbiaSierra LeoneSingaporeSomaliaSouth AfricaSouth AmericaSouth Central AsiaSouth Eastern AsiaSouthern EuropeSpainSri LankaSt. Vincent and the GrenadinesSudanSwedenSwitzerlandSyriaTaiwanThailandTrinidad and TobagoTurkeyUgandaUkraineUruguayUzbekistanVenezuelaVietnamWest IndiesWestern AfricaWestern AsiaWestern EuropeYemenZaireZimbabweAzores
Hawaiian
Race
Ancestry
AfghanAfricanAlaska NativeAlaskan AthabascanAlbanianAleutAlsatianAmericanApacheArabArapahoArgentineanArmenianAssyrian/Chaldean/SyriacAustralianAustrianBahamianBangladeshiBarbadianBasqueBelgianBelizeanBermudanBhutaneseBlackfeetBolivianBrazilianBritishBritish West IndianBulgarianBurmeseCajunCambodianCanadianCape VerdeanCarpatho RusynCelticCentral AmericanCentral American IndianCherokeeCheyenneChickasawChileanChineseChippewaChoctawColombianColvilleComancheCosta RicanCreeCreekCroatianCrowCubanCypriotCzechCzechoslovakianDanishDelawareDominicanDutchDutch West IndianEastern EuropeanEcuadorianEgyptianEnglishEstonianEthiopianEuropeanFijianFilipinoFinnishFrenchFrench American IndianFrench CanadianGermanGerman RussianGhanaianGreekGuamanian/ChamorroGuatemalanGuyaneseHaitianHmongHonduranHopiHoumaHungarianIcelanderIndian (Asian)IndonesianInupiatIranianIraqiIrishIroquoisIsraeliItalianJamaicanJapaneseJordanianKenyanKiowaKoreanLaotianLatvianLebaneseLiberianLithuanianLumbeeLuxembourgerMacedonianMalaysianMalteseMarshalleseMenomineeMexicanMexican American IndianMongolianMoroccanNative HawaiianNavajoNepaleseNew ZealanderNicaraguanNigerianNorthern EuropeanNorwegianOkinawanOsageOttawaPaiutePakistaniPalestinianPanamanianParaguayanPennsylvania GermanPeruvianPimaPolishPortuguesePotawatomiPuebloPuerto RicanPuget Sound SalishRomanianRussianSalvadoranSamoanScandinavianScotch-IrishScottishSeminoleSenegaleseSerbianShoshoneSierra LeoneanSiouxSlavicSlovakSloveneSomaliSouth AfricanSouth AmericanSouth American IndianSoviet UnionSpaniardSpanishSpanish AmericanSpanish American IndianSri LankanSubsaharan AfricanSudaneseSwedishSwissSyrianTaiwaneseThaiTlingit-HaidaTohono O'OdhamTonganTrinidadian and TobagonianTsimshianTurkishU.S. Virgin IslanderUkrainianUruguayanUteVenezuelanVietnameseWelshWest IndianYakamaYaquiYugoslavianYumanYup'ikZimbabwean
Immigration
NonimmigrantsImmigrantsAfghanistanAfricaAlbaniaArgentinaArmeniaAsiaAustraliaAustriaBahamasBangladeshBarbadosBelarusBelgiumBelizeBoliviaBosnia and HerzegovinaBrazilBulgariaBurma/MyanmarCabo VerdeCambodiaCameroonCanadaCaribbeanCentral AmericaChileChinaColombiaCongoCosta RicaCroatiaCubaCzechoslovakiaDenmarkDominicaDominican RepublicEastern AfricaEastern AsiaEastern EuropeEcuadorEgyptEl SalvadorEnglandEritreaEthiopiaEuropeFijiFranceGermanyGhanaGreeceGrenadaGuatemalaGuyanaHaitiHondurasHong KongHungaryIndiaIndonesiaIranIraqIrelandIsraelItalyJamaicaJapanJordanKazakhstanKenyaKoreaKuwaitLaosLatin AmericaLatviaLebanonLiberiaLithuaniaMalaysiaMexicoMicronesiaMiddle AfricaMoldovaMoroccoNepalNetherlandsNicaraguaNigeriaNorth AmericaNorth MacedoniaNorthern AfricaNorthern EuropeNorwayOceaniaPakistanPanamaPeruPhilippinesPolandPortugalRomaniaRussiaSaudi ArabiaScotlandSenegalSerbiaSierra LeoneSingaporeSomaliaSouth AfricaSouth AmericaSouth Central AsiaSouth Eastern AsiaSouthern EuropeSpainSri LankaSt. Vincent and the GrenadinesSudanSwedenSwitzerlandSyriaTaiwanThailandTrinidad and TobagoTurkeyUgandaUkraineUruguayUzbekistanVenezuelaVietnamWest IndiesWestern AfricaWestern AsiaWestern EuropeYemenZaireZimbabweAzores
In Labor Force | Age 45-54
Income
Poverty
Unemployment
Labor Participation
Family Structure
Vehicle Availability
Education Level
Disability

In Labor Force | Age 45-54 Comparison

Ugandans

Hawaiians

Exceptional
Tragic
83.7%
IN LABOR FORCE | AGE 45-54
99.5/ 100
METRIC RATING
36th/ 347
METRIC RANK
81.5%
IN LABOR FORCE | AGE 45-54
0.1/ 100
METRIC RATING
261st/ 347
METRIC RANK

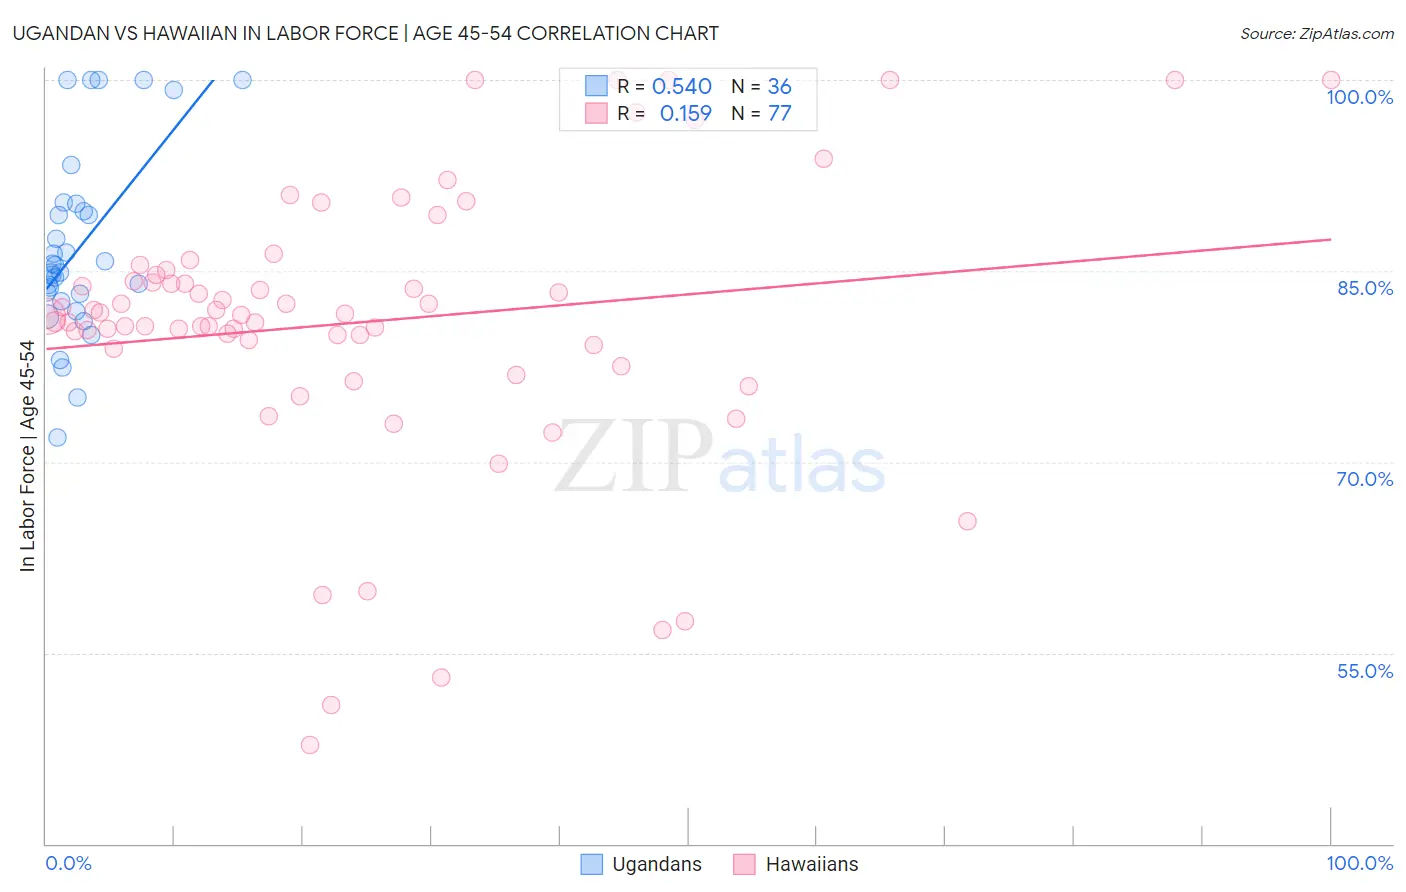
Ugandan vs Hawaiian In Labor Force | Age 45-54 Correlation Chart

The statistical analysis conducted on geographies consisting of 93,996,465 people shows a substantial positive correlation between the proportion of Ugandans and labor force participation rate among population between the ages 45 and 54 in the United States with a correlation coefficient (R) of 0.540 and weighted average of 83.7%. Similarly, the statistical analysis conducted on geographies consisting of 327,376,409 people shows a poor positive correlation between the proportion of Hawaiians and labor force participation rate among population between the ages 45 and 54 in the United States with a correlation coefficient (R) of 0.159 and weighted average of 81.5%, a difference of 2.7%.
Ugandan vs Hawaiian In Labor Force | Age 45-54

In Labor Force | Age 45-54 Correlation Summary

MeasurementUgandanHawaiian
Minimum71.9%47.8%
Maximum100.0%100.0%
Range28.1%52.2%
Mean86.8%81.0%
Median85.1%81.6%
Interquartile 25% (IQ1)82.9%79.1%
Interquartile 75% (IQ3)90.0%84.8%
Interquartile Range (IQR)7.1%5.8%
Standard Deviation (Sample)7.3%11.0%
Standard Deviation (Population)7.2%10.9%

Similar Demographics by In Labor Force | Age 45-54

Demographics Similar to Ugandans by In Labor Force | Age 45-54

In terms of in labor force | age 45-54, the demographic groups most similar to Ugandans are Kenyan (83.7%, a difference of 0.0%), Brazilian (83.7%, a difference of 0.0%), Swedish (83.7%, a difference of 0.020%), Immigrants from Venezuela (83.7%, a difference of 0.040%), and Immigrants from Cuba (83.7%, a difference of 0.040%).
DemographicsRating | RankIn Labor Force | Age 45-54
Immigrants | Pakistan
99.7
/100
|
#29
Exceptional
83.8%
Immigrants | Bulgaria
99.7
/100
|
#30
Exceptional
83.8%
Immigrants | Eritrea
99.7
/100
|
#31
Exceptional
83.8%
Turks
99.7
/100
|
#32
Exceptional
83.8%
Latvians
99.7
/100
|
#33
Exceptional
83.8%
Kenyans
99.5
/100
|
#34
Exceptional
83.7%
Brazilians
99.5
/100
|
#35
Exceptional
83.7%
Ugandans
99.5
/100
|
#36
Exceptional
83.7%
Swedes
99.4
/100
|
#37
Exceptional
83.7%
Immigrants | Venezuela
99.4
/100
|
#38
Exceptional
83.7%
Immigrants | Cuba
99.4
/100
|
#39
Exceptional
83.7%
Immigrants | Uganda
99.4
/100
|
#40
Exceptional
83.7%
Immigrants | Korea
99.3
/100
|
#41
Exceptional
83.7%
Immigrants | Moldova
99.3
/100
|
#42
Exceptional
83.7%
Venezuelans
99.2
/100
|
#43
Exceptional
83.6%

Demographics Similar to Hawaiians by In Labor Force | Age 45-54

In terms of in labor force | age 45-54, the demographic groups most similar to Hawaiians are Immigrants from Guyana (81.5%, a difference of 0.0%), Indonesian (81.5%, a difference of 0.010%), Spaniard (81.5%, a difference of 0.020%), Immigrants from West Indies (81.5%, a difference of 0.020%), and Guyanese (81.5%, a difference of 0.040%).
DemographicsRating | RankIn Labor Force | Age 45-54
Immigrants | Laos
0.2
/100
|
#254
Tragic
81.6%
Scotch-Irish
0.2
/100
|
#255
Tragic
81.6%
Barbadians
0.1
/100
|
#256
Tragic
81.6%
Immigrants | Congo
0.1
/100
|
#257
Tragic
81.6%
Immigrants | Fiji
0.1
/100
|
#258
Tragic
81.5%
Guyanese
0.1
/100
|
#259
Tragic
81.5%
Spaniards
0.1
/100
|
#260
Tragic
81.5%
Hawaiians
0.1
/100
|
#261
Tragic
81.5%
Immigrants | Guyana
0.1
/100
|
#262
Tragic
81.5%
Indonesians
0.1
/100
|
#263
Tragic
81.5%
Immigrants | West Indies
0.1
/100
|
#264
Tragic
81.5%
Hondurans
0.1
/100
|
#265
Tragic
81.4%
Immigrants | St. Vincent and the Grenadines
0.1
/100
|
#266
Tragic
81.4%
West Indians
0.1
/100
|
#267
Tragic
81.4%
Immigrants | Honduras
0.0
/100
|
#268
Tragic
81.4%