Turkish vs Immigrants from Uzbekistan In Labor Force | Age 16-19

COMPARE

Turkish
Race
Ancestry
AfghanAfricanAlaska NativeAlaskan AthabascanAlbanianAleutAlsatianAmericanApacheArabArapahoArgentineanArmenianAssyrian/Chaldean/SyriacAustralianAustrianBahamianBangladeshiBarbadianBasqueBelgianBelizeanBermudanBhutaneseBlackfeetBolivianBrazilianBritishBritish West IndianBulgarianBurmeseCajunCambodianCanadianCape VerdeanCarpatho RusynCelticCentral AmericanCentral American IndianCherokeeCheyenneChickasawChileanChineseChippewaChoctawColombianColvilleComancheCosta RicanCreeCreekCroatianCrowCubanCypriotCzechCzechoslovakianDanishDelawareDominicanDutchDutch West IndianEastern EuropeanEcuadorianEgyptianEnglishEstonianEthiopianEuropeanFijianFilipinoFinnishFrenchFrench American IndianFrench CanadianGermanGerman RussianGhanaianGreekGuamanian/ChamorroGuatemalanGuyaneseHaitianHmongHonduranHopiHoumaHungarianIcelanderIndian (Asian)IndonesianInupiatIranianIraqiIrishIroquoisIsraeliItalianJamaicanJapaneseJordanianKenyanKiowaKoreanLaotianLatvianLebaneseLiberianLithuanianLumbeeLuxembourgerMacedonianMalaysianMalteseMarshalleseMenomineeMexicanMexican American IndianMongolianMoroccanNative HawaiianNavajoNepaleseNew ZealanderNicaraguanNigerianNorthern EuropeanNorwegianOkinawanOsageOttawaPaiutePakistaniPalestinianPanamanianParaguayanPennsylvania GermanPeruvianPimaPolishPortuguesePotawatomiPuebloPuerto RicanPuget Sound SalishRomanianRussianSalvadoranSamoanScandinavianScotch-IrishScottishSeminoleSenegaleseSerbianShoshoneSierra LeoneanSiouxSlavicSlovakSloveneSomaliSouth AfricanSouth AmericanSouth American IndianSoviet UnionSpaniardSpanishSpanish AmericanSpanish American IndianSri LankanSubsaharan AfricanSudaneseSwedishSwissSyrianTaiwaneseThaiTlingit-HaidaTohono O'OdhamTonganTrinidadian and TobagonianTsimshianTurkishU.S. Virgin IslanderUgandanUkrainianUruguayanUteVenezuelanVietnameseWelshWest IndianYakamaYaquiYugoslavianYumanYup'ikZimbabwean
Immigration
NonimmigrantsImmigrantsAfghanistanAfricaAlbaniaArgentinaArmeniaAsiaAustraliaAustriaBahamasBangladeshBarbadosBelarusBelgiumBelizeBoliviaBosnia and HerzegovinaBrazilBulgariaBurma/MyanmarCabo VerdeCambodiaCameroonCanadaCaribbeanCentral AmericaChileChinaColombiaCongoCosta RicaCroatiaCubaCzechoslovakiaDenmarkDominicaDominican RepublicEastern AfricaEastern AsiaEastern EuropeEcuadorEgyptEl SalvadorEnglandEritreaEthiopiaEuropeFijiFranceGermanyGhanaGreeceGrenadaGuatemalaGuyanaHaitiHondurasHong KongHungaryIndiaIndonesiaIranIraqIrelandIsraelItalyJamaicaJapanJordanKazakhstanKenyaKoreaKuwaitLaosLatin AmericaLatviaLebanonLiberiaLithuaniaMalaysiaMexicoMicronesiaMiddle AfricaMoldovaMoroccoNepalNetherlandsNicaraguaNigeriaNorth AmericaNorth MacedoniaNorthern AfricaNorthern EuropeNorwayOceaniaPakistanPanamaPeruPhilippinesPolandPortugalRomaniaRussiaSaudi ArabiaScotlandSenegalSerbiaSierra LeoneSingaporeSomaliaSouth AfricaSouth AmericaSouth Central AsiaSouth Eastern AsiaSouthern EuropeSpainSri LankaSt. Vincent and the GrenadinesSudanSwedenSwitzerlandSyriaTaiwanThailandTrinidad and TobagoTurkeyUgandaUkraineUruguayVenezuelaVietnamWest IndiesWestern AfricaWestern AsiaWestern EuropeYemenZaireZimbabweAzores
Immigrants from Uzbekistan
Race
Ancestry
AfghanAfricanAlaska NativeAlaskan AthabascanAlbanianAleutAlsatianAmericanApacheArabArapahoArgentineanArmenianAssyrian/Chaldean/SyriacAustralianAustrianBahamianBangladeshiBarbadianBasqueBelgianBelizeanBermudanBhutaneseBlackfeetBolivianBrazilianBritishBritish West IndianBulgarianBurmeseCajunCambodianCanadianCape VerdeanCarpatho RusynCelticCentral AmericanCentral American IndianCherokeeCheyenneChickasawChileanChineseChippewaChoctawColombianColvilleComancheCosta RicanCreeCreekCroatianCrowCubanCypriotCzechCzechoslovakianDanishDelawareDominicanDutchDutch West IndianEastern EuropeanEcuadorianEgyptianEnglishEstonianEthiopianEuropeanFijianFilipinoFinnishFrenchFrench American IndianFrench CanadianGermanGerman RussianGhanaianGreekGuamanian/ChamorroGuatemalanGuyaneseHaitianHmongHonduranHopiHoumaHungarianIcelanderIndian (Asian)IndonesianInupiatIranianIraqiIrishIroquoisIsraeliItalianJamaicanJapaneseJordanianKenyanKiowaKoreanLaotianLatvianLebaneseLiberianLithuanianLumbeeLuxembourgerMacedonianMalaysianMalteseMarshalleseMenomineeMexicanMexican American IndianMongolianMoroccanNative HawaiianNavajoNepaleseNew ZealanderNicaraguanNigerianNorthern EuropeanNorwegianOkinawanOsageOttawaPaiutePakistaniPalestinianPanamanianParaguayanPennsylvania GermanPeruvianPimaPolishPortuguesePotawatomiPuebloPuerto RicanPuget Sound SalishRomanianRussianSalvadoranSamoanScandinavianScotch-IrishScottishSeminoleSenegaleseSerbianShoshoneSierra LeoneanSiouxSlavicSlovakSloveneSomaliSouth AfricanSouth AmericanSouth American IndianSoviet UnionSpaniardSpanishSpanish AmericanSpanish American IndianSri LankanSubsaharan AfricanSudaneseSwedishSwissSyrianTaiwaneseThaiTlingit-HaidaTohono O'OdhamTonganTrinidadian and TobagonianTsimshianU.S. Virgin IslanderUgandanUkrainianUruguayanUteVenezuelanVietnameseWelshWest IndianYakamaYaquiYugoslavianYumanYup'ikZimbabwean
Immigration
NonimmigrantsImmigrantsAfghanistanAfricaAlbaniaArgentinaArmeniaAsiaAustraliaAustriaBahamasBangladeshBarbadosBelarusBelgiumBelizeBoliviaBosnia and HerzegovinaBrazilBulgariaBurma/MyanmarCabo VerdeCambodiaCameroonCanadaCaribbeanCentral AmericaChileChinaColombiaCongoCosta RicaCroatiaCubaCzechoslovakiaDenmarkDominicaDominican RepublicEastern AfricaEastern AsiaEastern EuropeEcuadorEgyptEl SalvadorEnglandEritreaEthiopiaEuropeFijiFranceGermanyGhanaGreeceGrenadaGuatemalaGuyanaHaitiHondurasHong KongHungaryIndiaIndonesiaIranIraqIrelandIsraelItalyJamaicaJapanJordanKazakhstanKenyaKoreaKuwaitLaosLatin AmericaLatviaLebanonLiberiaLithuaniaMalaysiaMexicoMicronesiaMiddle AfricaMoldovaMoroccoNepalNetherlandsNicaraguaNigeriaNorth AmericaNorth MacedoniaNorthern AfricaNorthern EuropeNorwayOceaniaPakistanPanamaPeruPhilippinesPolandPortugalRomaniaRussiaSaudi ArabiaScotlandSenegalSerbiaSierra LeoneSingaporeSomaliaSouth AfricaSouth AmericaSouth Central AsiaSouth Eastern AsiaSouthern EuropeSpainSri LankaSt. Vincent and the GrenadinesSudanSwedenSwitzerlandSyriaTaiwanThailandTrinidad and TobagoTurkeyUgandaUkraineUruguayUzbekistanVenezuelaVietnamWest IndiesWestern AfricaWestern AsiaWestern EuropeYemenZaireZimbabweAzores
In Labor Force | Age 16-19
Income
Poverty
Unemployment
Labor Participation
Family Structure
Vehicle Availability
Education Level
Disability

In Labor Force | Age 16-19 Comparison

Turks

Immigrants from Uzbekistan

Tragic
Tragic
35.4%
IN LABOR FORCE | AGE 16-19
7.3/ 100
METRIC RATING
221st/ 347
METRIC RANK
29.2%
IN LABOR FORCE | AGE 16-19
0.0/ 100
METRIC RATING
339th/ 347
METRIC RANK

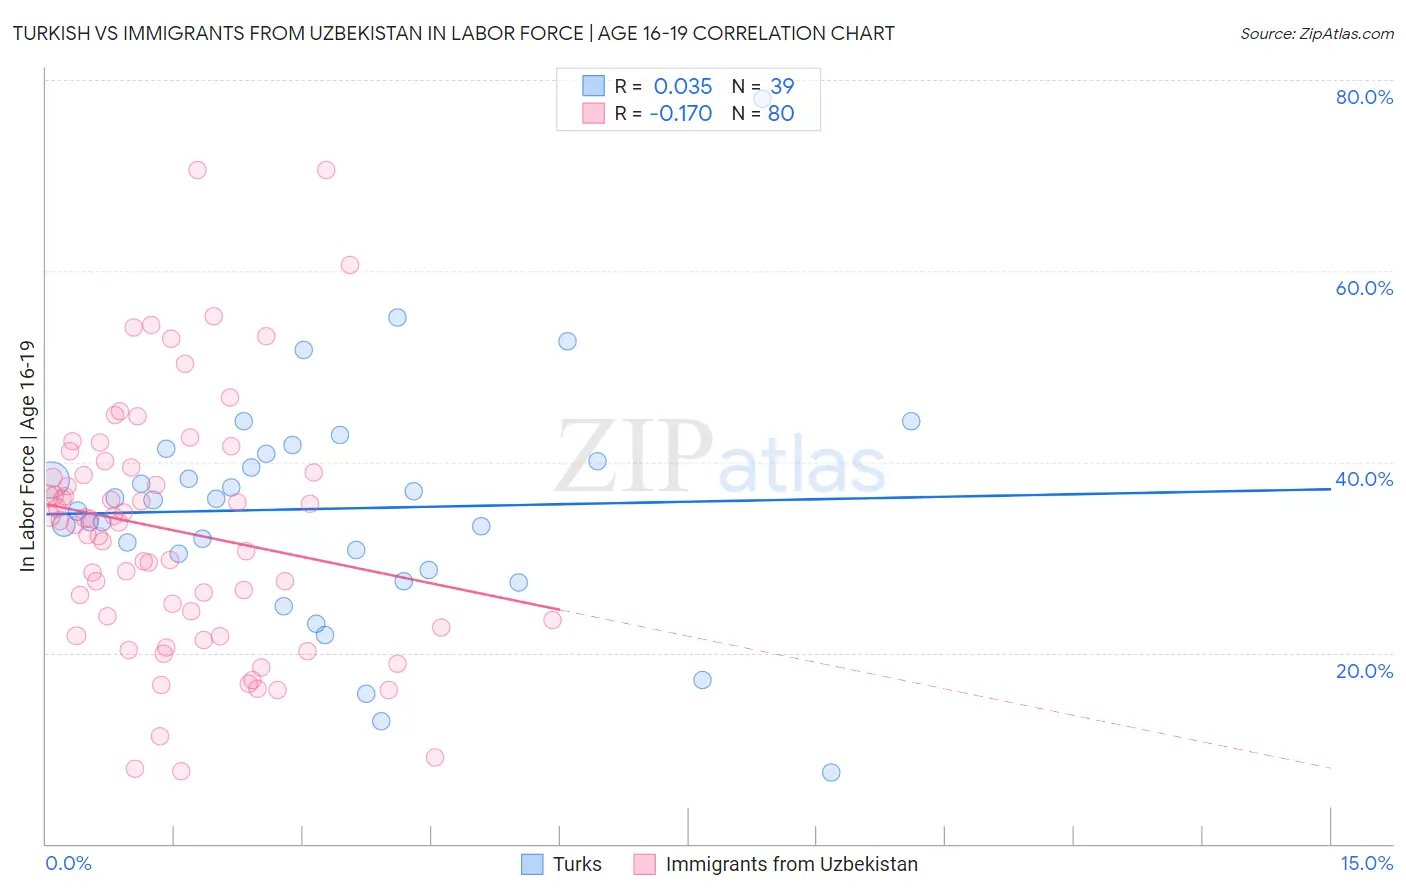
Turkish vs Immigrants from Uzbekistan In Labor Force | Age 16-19 Correlation Chart

The statistical analysis conducted on geographies consisting of 271,508,687 people shows no correlation between the proportion of Turks and labor force participation rate among population between the ages 16 and 19 in the United States with a correlation coefficient (R) of 0.035 and weighted average of 35.4%. Similarly, the statistical analysis conducted on geographies consisting of 118,707,763 people shows a poor negative correlation between the proportion of Immigrants from Uzbekistan and labor force participation rate among population between the ages 16 and 19 in the United States with a correlation coefficient (R) of -0.170 and weighted average of 29.2%, a difference of 21.4%.
Turkish vs Immigrants from Uzbekistan In Labor Force | Age 16-19

In Labor Force | Age 16-19 Correlation Summary

MeasurementTurkishImmigrants from Uzbekistan
Minimum7.4%7.6%
Maximum78.1%70.6%
Range70.7%63.0%
Mean35.1%32.8%
Median36.0%33.7%
Interquartile 25% (IQ1)28.6%23.1%
Interquartile 75% (IQ3)40.8%39.2%
Interquartile Range (IQR)12.2%16.1%
Standard Deviation (Sample)12.4%13.1%
Standard Deviation (Population)12.3%13.0%

Similar Demographics by In Labor Force | Age 16-19

Demographics Similar to Turks by In Labor Force | Age 16-19

In terms of in labor force | age 16-19, the demographic groups most similar to Turks are Immigrants from Ghana (35.4%, a difference of 0.010%), Ghanaian (35.3%, a difference of 0.16%), Honduran (35.3%, a difference of 0.17%), Immigrants from Bahamas (35.5%, a difference of 0.18%), and Guatemalan (35.5%, a difference of 0.23%).
DemographicsRating | RankIn Labor Force | Age 16-19
Apache
11.0
/100
|
#214
Poor
35.6%
Immigrants | South Eastern Asia
10.8
/100
|
#215
Poor
35.6%
Dutch West Indians
10.7
/100
|
#216
Poor
35.6%
Immigrants | Costa Rica
10.7
/100
|
#217
Poor
35.6%
Sri Lankans
9.8
/100
|
#218
Tragic
35.5%
Guatemalans
8.6
/100
|
#219
Tragic
35.5%
Immigrants | Bahamas
8.3
/100
|
#220
Tragic
35.5%
Turks
7.3
/100
|
#221
Tragic
35.4%
Immigrants | Ghana
7.3
/100
|
#222
Tragic
35.4%
Ghanaians
6.5
/100
|
#223
Tragic
35.3%
Hondurans
6.5
/100
|
#224
Tragic
35.3%
Immigrants | Belgium
6.1
/100
|
#225
Tragic
35.3%
Immigrants | Guatemala
5.7
/100
|
#226
Tragic
35.3%
Mongolians
5.7
/100
|
#227
Tragic
35.3%
Immigrants | Senegal
5.5
/100
|
#228
Tragic
35.3%

Demographics Similar to Immigrants from Uzbekistan by In Labor Force | Age 16-19

In terms of in labor force | age 16-19, the demographic groups most similar to Immigrants from Uzbekistan are British West Indian (29.1%, a difference of 0.20%), Immigrants from Armenia (29.0%, a difference of 0.43%), Immigrants from Barbados (29.0%, a difference of 0.58%), Vietnamese (29.6%, a difference of 1.4%), and Immigrants from Bangladesh (30.0%, a difference of 3.1%).
DemographicsRating | RankIn Labor Force | Age 16-19
Immigrants | Israel
0.0
/100
|
#332
Tragic
30.5%
Immigrants | Hong Kong
0.0
/100
|
#333
Tragic
30.5%
Puerto Ricans
0.0
/100
|
#334
Tragic
30.3%
Immigrants | Cuba
0.0
/100
|
#335
Tragic
30.2%
Immigrants | Trinidad and Tobago
0.0
/100
|
#336
Tragic
30.2%
Immigrants | Bangladesh
0.0
/100
|
#337
Tragic
30.0%
Vietnamese
0.0
/100
|
#338
Tragic
29.6%
Immigrants | Uzbekistan
0.0
/100
|
#339
Tragic
29.2%
British West Indians
0.0
/100
|
#340
Tragic
29.1%
Immigrants | Armenia
0.0
/100
|
#341
Tragic
29.0%
Immigrants | Barbados
0.0
/100
|
#342
Tragic
29.0%
Yuman
0.0
/100
|
#343
Tragic
27.7%
Guyanese
0.0
/100
|
#344
Tragic
27.4%
Immigrants | Guyana
0.0
/100
|
#345
Tragic
27.3%
Immigrants | St. Vincent and the Grenadines
0.0
/100
|
#346
Tragic
26.3%