Tsimshian vs Laotian In Labor Force | Age 35-44

COMPARE

Tsimshian
Race
Ancestry
AfghanAfricanAlaska NativeAlaskan AthabascanAlbanianAleutAlsatianAmericanApacheArabArapahoArgentineanArmenianAssyrian/Chaldean/SyriacAustralianAustrianBahamianBangladeshiBarbadianBasqueBelgianBelizeanBermudanBhutaneseBlackfeetBolivianBrazilianBritishBritish West IndianBulgarianBurmeseCajunCambodianCanadianCape VerdeanCarpatho RusynCelticCentral AmericanCentral American IndianCherokeeCheyenneChickasawChileanChineseChippewaChoctawColombianColvilleComancheCosta RicanCreeCreekCroatianCrowCubanCypriotCzechCzechoslovakianDanishDelawareDominicanDutchDutch West IndianEastern EuropeanEcuadorianEgyptianEnglishEstonianEthiopianEuropeanFijianFilipinoFinnishFrenchFrench American IndianFrench CanadianGermanGerman RussianGhanaianGreekGuamanian/ChamorroGuatemalanGuyaneseHaitianHmongHonduranHopiHoumaHungarianIcelanderIndian (Asian)IndonesianInupiatIranianIraqiIrishIroquoisIsraeliItalianJamaicanJapaneseJordanianKenyanKiowaKoreanLatvianLebaneseLiberianLithuanianLumbeeLuxembourgerMacedonianMalaysianMalteseMarshalleseMenomineeMexicanMexican American IndianMongolianMoroccanNative HawaiianNavajoNepaleseNew ZealanderNicaraguanNigerianNorthern EuropeanNorwegianOkinawanOsageOttawaPaiutePakistaniPalestinianPanamanianParaguayanPennsylvania GermanPeruvianPimaPolishPortuguesePotawatomiPuebloPuerto RicanPuget Sound SalishRomanianRussianSalvadoranSamoanScandinavianScotch-IrishScottishSeminoleSenegaleseSerbianShoshoneSierra LeoneanSiouxSlavicSlovakSloveneSomaliSouth AfricanSouth AmericanSouth American IndianSoviet UnionSpaniardSpanishSpanish AmericanSpanish American IndianSri LankanSubsaharan AfricanSudaneseSwedishSwissSyrianTaiwaneseThaiTlingit-HaidaTohono O'OdhamTonganTrinidadian and TobagonianTsimshianTurkishU.S. Virgin IslanderUgandanUkrainianUruguayanUteVenezuelanVietnameseWelshWest IndianYakamaYaquiYugoslavianYumanYup'ikZimbabwean
Immigration
NonimmigrantsImmigrantsAfghanistanAfricaAlbaniaArgentinaArmeniaAsiaAustraliaAustriaBahamasBangladeshBarbadosBelarusBelgiumBelizeBoliviaBosnia and HerzegovinaBrazilBulgariaBurma/MyanmarCabo VerdeCambodiaCameroonCanadaCaribbeanCentral AmericaChileChinaColombiaCongoCosta RicaCroatiaCubaCzechoslovakiaDenmarkDominicaDominican RepublicEastern AfricaEastern AsiaEastern EuropeEcuadorEgyptEl SalvadorEnglandEritreaEthiopiaEuropeFijiFranceGermanyGhanaGreeceGrenadaGuatemalaGuyanaHaitiHondurasHong KongHungaryIndiaIndonesiaIranIraqIrelandIsraelItalyJamaicaJapanJordanKazakhstanKenyaKoreaKuwaitLaosLatin AmericaLatviaLebanonLiberiaLithuaniaMalaysiaMexicoMicronesiaMiddle AfricaMoldovaMoroccoNepalNetherlandsNicaraguaNigeriaNorth AmericaNorth MacedoniaNorthern AfricaNorthern EuropeNorwayOceaniaPakistanPanamaPeruPhilippinesPolandPortugalRomaniaRussiaSaudi ArabiaScotlandSenegalSerbiaSierra LeoneSingaporeSomaliaSouth AfricaSouth AmericaSouth Central AsiaSouth Eastern AsiaSouthern EuropeSpainSri LankaSt. Vincent and the GrenadinesSudanSwedenSwitzerlandSyriaTaiwanThailandTrinidad and TobagoTurkeyUgandaUkraineUruguayUzbekistanVenezuelaVietnamWest IndiesWestern AfricaWestern AsiaWestern EuropeYemenZaireZimbabweAzores
Laotian
Race
Ancestry
AfghanAfricanAlaska NativeAlaskan AthabascanAlbanianAleutAlsatianAmericanApacheArabArapahoArgentineanArmenianAssyrian/Chaldean/SyriacAustralianAustrianBahamianBangladeshiBarbadianBasqueBelgianBelizeanBermudanBhutaneseBlackfeetBolivianBrazilianBritishBritish West IndianBulgarianBurmeseCajunCambodianCanadianCape VerdeanCarpatho RusynCelticCentral AmericanCentral American IndianCherokeeCheyenneChickasawChileanChineseChippewaChoctawColombianColvilleComancheCosta RicanCreeCreekCroatianCrowCubanCypriotCzechCzechoslovakianDanishDelawareDominicanDutchDutch West IndianEastern EuropeanEcuadorianEgyptianEnglishEstonianEthiopianEuropeanFijianFilipinoFinnishFrenchFrench American IndianFrench CanadianGermanGerman RussianGhanaianGreekGuamanian/ChamorroGuatemalanGuyaneseHaitianHmongHonduranHopiHoumaHungarianIcelanderIndian (Asian)IndonesianInupiatIranianIraqiIrishIroquoisIsraeliItalianJamaicanJapaneseJordanianKenyanKiowaKoreanLaotianLatvianLebaneseLiberianLithuanianLumbeeLuxembourgerMacedonianMalaysianMalteseMarshalleseMenomineeMexicanMexican American IndianMongolianMoroccanNative HawaiianNavajoNepaleseNew ZealanderNicaraguanNigerianNorthern EuropeanNorwegianOkinawanOsageOttawaPaiutePakistaniPalestinianPanamanianParaguayanPennsylvania GermanPeruvianPimaPolishPortuguesePotawatomiPuebloPuerto RicanPuget Sound SalishRomanianRussianSalvadoranSamoanScandinavianScotch-IrishScottishSeminoleSenegaleseSerbianShoshoneSierra LeoneanSiouxSlavicSlovakSloveneSomaliSouth AfricanSouth AmericanSouth American IndianSoviet UnionSpaniardSpanishSpanish AmericanSpanish American IndianSri LankanSubsaharan AfricanSudaneseSwedishSwissSyrianTaiwaneseThaiTlingit-HaidaTohono O'OdhamTonganTrinidadian and TobagonianTurkishU.S. Virgin IslanderUgandanUkrainianUruguayanUteVenezuelanVietnameseWelshWest IndianYakamaYaquiYugoslavianYumanYup'ikZimbabwean
Immigration
NonimmigrantsImmigrantsAfghanistanAfricaAlbaniaArgentinaArmeniaAsiaAustraliaAustriaBahamasBangladeshBarbadosBelarusBelgiumBelizeBoliviaBosnia and HerzegovinaBrazilBulgariaBurma/MyanmarCabo VerdeCambodiaCameroonCanadaCaribbeanCentral AmericaChileChinaColombiaCongoCosta RicaCroatiaCubaCzechoslovakiaDenmarkDominicaDominican RepublicEastern AfricaEastern AsiaEastern EuropeEcuadorEgyptEl SalvadorEnglandEritreaEthiopiaEuropeFijiFranceGermanyGhanaGreeceGrenadaGuatemalaGuyanaHaitiHondurasHong KongHungaryIndiaIndonesiaIranIraqIrelandIsraelItalyJamaicaJapanJordanKazakhstanKenyaKoreaKuwaitLaosLatin AmericaLatviaLebanonLiberiaLithuaniaMalaysiaMexicoMicronesiaMiddle AfricaMoldovaMoroccoNepalNetherlandsNicaraguaNigeriaNorth AmericaNorth MacedoniaNorthern AfricaNorthern EuropeNorwayOceaniaPakistanPanamaPeruPhilippinesPolandPortugalRomaniaRussiaSaudi ArabiaScotlandSenegalSerbiaSierra LeoneSingaporeSomaliaSouth AfricaSouth AmericaSouth Central AsiaSouth Eastern AsiaSouthern EuropeSpainSri LankaSt. Vincent and the GrenadinesSudanSwedenSwitzerlandSyriaTaiwanThailandTrinidad and TobagoTurkeyUgandaUkraineUruguayUzbekistanVenezuelaVietnamWest IndiesWestern AfricaWestern AsiaWestern EuropeYemenZaireZimbabweAzores
In Labor Force | Age 35-44
Income
Poverty
Unemployment
Labor Participation
Family Structure
Vehicle Availability
Education Level
Disability

In Labor Force | Age 35-44 Comparison

Tsimshian

Laotians

Tragic
Poor
83.5%
IN LABOR FORCE | AGE 35-44
0.2/ 100
METRIC RATING
258th/ 347
METRIC RANK
84.2%
IN LABOR FORCE | AGE 35-44
19.0/ 100
METRIC RATING
207th/ 347
METRIC RANK

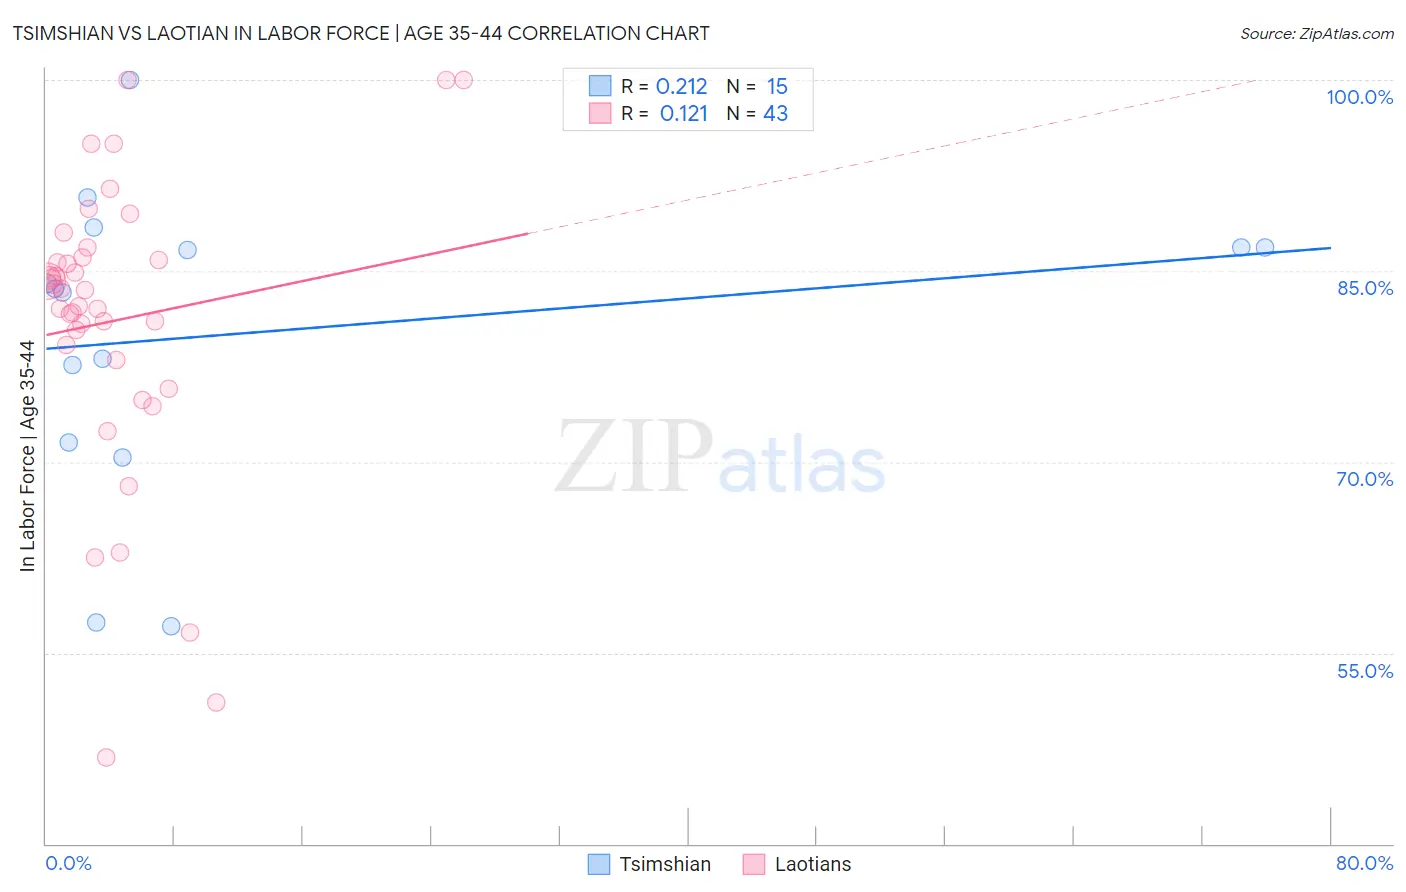
Tsimshian vs Laotian In Labor Force | Age 35-44 Correlation Chart

The statistical analysis conducted on geographies consisting of 15,626,462 people shows a weak positive correlation between the proportion of Tsimshian and labor force participation rate among population between the ages 35 and 44 in the United States with a correlation coefficient (R) of 0.212 and weighted average of 83.5%. Similarly, the statistical analysis conducted on geographies consisting of 224,767,288 people shows a poor positive correlation between the proportion of Laotians and labor force participation rate among population between the ages 35 and 44 in the United States with a correlation coefficient (R) of 0.121 and weighted average of 84.2%, a difference of 0.75%.
Tsimshian vs Laotian In Labor Force | Age 35-44

In Labor Force | Age 35-44 Correlation Summary

MeasurementTsimshianLaotian
Minimum57.1%46.8%
Maximum100.0%100.0%
Range42.9%53.2%
Mean80.2%81.1%
Median83.6%83.5%
Interquartile 25% (IQ1)71.6%78.0%
Interquartile 75% (IQ3)86.8%86.1%
Interquartile Range (IQR)15.2%8.0%
Standard Deviation (Sample)11.9%11.6%
Standard Deviation (Population)11.5%11.5%

Similar Demographics by In Labor Force | Age 35-44

Demographics Similar to Tsimshian by In Labor Force | Age 35-44

In terms of in labor force | age 35-44, the demographic groups most similar to Tsimshian are Basque (83.6%, a difference of 0.020%), Immigrants from El Salvador (83.5%, a difference of 0.020%), Vietnamese (83.5%, a difference of 0.030%), Japanese (83.6%, a difference of 0.040%), and Immigrants from Dominica (83.5%, a difference of 0.040%).
DemographicsRating | RankIn Labor Force | Age 35-44
Salvadorans
0.4
/100
|
#251
Tragic
83.6%
Immigrants | Guyana
0.4
/100
|
#252
Tragic
83.6%
Lebanese
0.4
/100
|
#253
Tragic
83.6%
Tongans
0.4
/100
|
#254
Tragic
83.6%
Immigrants | Azores
0.3
/100
|
#255
Tragic
83.6%
Japanese
0.3
/100
|
#256
Tragic
83.6%
Basques
0.3
/100
|
#257
Tragic
83.6%
Tsimshian
0.2
/100
|
#258
Tragic
83.5%
Immigrants | El Salvador
0.2
/100
|
#259
Tragic
83.5%
Vietnamese
0.2
/100
|
#260
Tragic
83.5%
Immigrants | Dominica
0.2
/100
|
#261
Tragic
83.5%
Immigrants | Congo
0.2
/100
|
#262
Tragic
83.5%
Iroquois
0.2
/100
|
#263
Tragic
83.5%
Scotch-Irish
0.1
/100
|
#264
Tragic
83.5%
Central Americans
0.1
/100
|
#265
Tragic
83.5%

Demographics Similar to Laotians by In Labor Force | Age 35-44

In terms of in labor force | age 35-44, the demographic groups most similar to Laotians are Immigrants from Costa Rica (84.2%, a difference of 0.0%), Canadian (84.2%, a difference of 0.010%), Immigrants from Canada (84.2%, a difference of 0.010%), Immigrants from North America (84.2%, a difference of 0.010%), and Swiss (84.2%, a difference of 0.020%).
DemographicsRating | RankIn Labor Force | Age 35-44
Moroccans
23.2
/100
|
#200
Fair
84.2%
British
23.0
/100
|
#201
Fair
84.2%
Immigrants | Uzbekistan
22.8
/100
|
#202
Fair
84.2%
Immigrants | South Eastern Asia
22.4
/100
|
#203
Fair
84.2%
Canadians
19.9
/100
|
#204
Poor
84.2%
Immigrants | Canada
19.6
/100
|
#205
Poor
84.2%
Immigrants | Costa Rica
19.5
/100
|
#206
Poor
84.2%
Laotians
19.0
/100
|
#207
Poor
84.2%
Immigrants | North America
18.1
/100
|
#208
Poor
84.2%
Swiss
17.4
/100
|
#209
Poor
84.2%
New Zealanders
16.2
/100
|
#210
Poor
84.1%
Immigrants | Ecuador
15.2
/100
|
#211
Poor
84.1%
Israelis
14.0
/100
|
#212
Poor
84.1%
Bangladeshis
13.7
/100
|
#213
Poor
84.1%
Immigrants | Barbados
13.2
/100
|
#214
Poor
84.1%