Trinidadian and Tobagonian vs Immigrants from Egypt In Labor Force | Age 25-29

COMPARE

Trinidadian and Tobagonian
Race
Ancestry
AfghanAfricanAlaska NativeAlaskan AthabascanAlbanianAleutAlsatianAmericanApacheArabArapahoArgentineanArmenianAssyrian/Chaldean/SyriacAustralianAustrianBahamianBangladeshiBarbadianBasqueBelgianBelizeanBermudanBhutaneseBlackfeetBolivianBrazilianBritishBritish West IndianBulgarianBurmeseCajunCambodianCanadianCape VerdeanCarpatho RusynCelticCentral AmericanCentral American IndianCherokeeCheyenneChickasawChileanChineseChippewaChoctawColombianColvilleComancheCosta RicanCreeCreekCroatianCrowCubanCypriotCzechCzechoslovakianDanishDelawareDominicanDutchDutch West IndianEastern EuropeanEcuadorianEgyptianEnglishEstonianEthiopianEuropeanFijianFilipinoFinnishFrenchFrench American IndianFrench CanadianGermanGerman RussianGhanaianGreekGuamanian/ChamorroGuatemalanGuyaneseHaitianHmongHonduranHopiHoumaHungarianIcelanderIndian (Asian)IndonesianInupiatIranianIraqiIrishIroquoisIsraeliItalianJamaicanJapaneseJordanianKenyanKiowaKoreanLaotianLatvianLebaneseLiberianLithuanianLumbeeLuxembourgerMacedonianMalaysianMalteseMarshalleseMenomineeMexicanMexican American IndianMongolianMoroccanNative HawaiianNavajoNepaleseNew ZealanderNicaraguanNigerianNorthern EuropeanNorwegianOkinawanOsageOttawaPaiutePakistaniPalestinianPanamanianParaguayanPennsylvania GermanPeruvianPimaPolishPortuguesePotawatomiPuebloPuerto RicanPuget Sound SalishRomanianRussianSalvadoranSamoanScandinavianScotch-IrishScottishSeminoleSenegaleseSerbianShoshoneSierra LeoneanSiouxSlavicSlovakSloveneSomaliSouth AfricanSouth AmericanSouth American IndianSoviet UnionSpaniardSpanishSpanish AmericanSpanish American IndianSri LankanSubsaharan AfricanSudaneseSwedishSwissSyrianTaiwaneseThaiTlingit-HaidaTohono O'OdhamTonganTrinidadian and TobagonianTsimshianTurkishU.S. Virgin IslanderUgandanUkrainianUruguayanUteVenezuelanVietnameseWelshWest IndianYakamaYaquiYugoslavianYumanYup'ikZimbabwean
Immigration
NonimmigrantsImmigrantsAfghanistanAfricaAlbaniaArgentinaArmeniaAsiaAustraliaAustriaBahamasBangladeshBarbadosBelarusBelgiumBelizeBoliviaBosnia and HerzegovinaBrazilBulgariaBurma/MyanmarCabo VerdeCambodiaCameroonCanadaCaribbeanCentral AmericaChileChinaColombiaCongoCosta RicaCroatiaCubaCzechoslovakiaDenmarkDominicaDominican RepublicEastern AfricaEastern AsiaEastern EuropeEcuadorEl SalvadorEnglandEritreaEthiopiaEuropeFijiFranceGermanyGhanaGreeceGrenadaGuatemalaGuyanaHaitiHondurasHong KongHungaryIndiaIndonesiaIranIraqIrelandIsraelItalyJamaicaJapanJordanKazakhstanKenyaKoreaKuwaitLaosLatin AmericaLatviaLebanonLiberiaLithuaniaMalaysiaMexicoMicronesiaMiddle AfricaMoldovaMoroccoNepalNetherlandsNicaraguaNigeriaNorth AmericaNorth MacedoniaNorthern AfricaNorthern EuropeNorwayOceaniaPakistanPanamaPeruPhilippinesPolandPortugalRomaniaRussiaSaudi ArabiaScotlandSenegalSerbiaSierra LeoneSingaporeSomaliaSouth AfricaSouth AmericaSouth Central AsiaSouth Eastern AsiaSouthern EuropeSpainSri LankaSt. Vincent and the GrenadinesSudanSwedenSwitzerlandSyriaTaiwanThailandTrinidad and TobagoTurkeyUgandaUkraineUruguayUzbekistanVenezuelaVietnamWest IndiesWestern AfricaWestern AsiaWestern EuropeYemenZaireZimbabweAzores
Immigrants from Egypt
Race
Ancestry
AfghanAfricanAlaska NativeAlaskan AthabascanAlbanianAleutAlsatianAmericanApacheArabArapahoArgentineanArmenianAssyrian/Chaldean/SyriacAustralianAustrianBahamianBangladeshiBarbadianBasqueBelgianBelizeanBermudanBhutaneseBlackfeetBolivianBrazilianBritishBritish West IndianBulgarianBurmeseCajunCambodianCanadianCape VerdeanCarpatho RusynCelticCentral AmericanCentral American IndianCherokeeCheyenneChickasawChileanChineseChippewaChoctawColombianColvilleComancheCosta RicanCreeCreekCroatianCrowCubanCypriotCzechCzechoslovakianDanishDelawareDominicanDutchDutch West IndianEastern EuropeanEcuadorianEgyptianEnglishEstonianEthiopianEuropeanFijianFilipinoFinnishFrenchFrench American IndianFrench CanadianGermanGerman RussianGhanaianGreekGuamanian/ChamorroGuatemalanGuyaneseHaitianHmongHonduranHopiHoumaHungarianIcelanderIndian (Asian)IndonesianInupiatIranianIraqiIrishIroquoisIsraeliItalianJamaicanJapaneseJordanianKenyanKiowaKoreanLaotianLatvianLebaneseLiberianLithuanianLumbeeLuxembourgerMacedonianMalaysianMalteseMarshalleseMenomineeMexicanMexican American IndianMongolianMoroccanNative HawaiianNavajoNepaleseNew ZealanderNicaraguanNigerianNorthern EuropeanNorwegianOkinawanOsageOttawaPaiutePakistaniPalestinianPanamanianParaguayanPennsylvania GermanPeruvianPimaPolishPortuguesePotawatomiPuebloPuerto RicanPuget Sound SalishRomanianRussianSalvadoranSamoanScandinavianScotch-IrishScottishSeminoleSenegaleseSerbianShoshoneSierra LeoneanSiouxSlavicSlovakSloveneSomaliSouth AfricanSouth AmericanSouth American IndianSoviet UnionSpaniardSpanishSpanish AmericanSpanish American IndianSri LankanSubsaharan AfricanSudaneseSwedishSwissSyrianTaiwaneseThaiTlingit-HaidaTohono O'OdhamTonganTsimshianTurkishU.S. Virgin IslanderUgandanUkrainianUruguayanUteVenezuelanVietnameseWelshWest IndianYakamaYaquiYugoslavianYumanYup'ikZimbabwean
Immigration
NonimmigrantsImmigrantsAfghanistanAfricaAlbaniaArgentinaArmeniaAsiaAustraliaAustriaBahamasBangladeshBarbadosBelarusBelgiumBelizeBoliviaBosnia and HerzegovinaBrazilBulgariaBurma/MyanmarCabo VerdeCambodiaCameroonCanadaCaribbeanCentral AmericaChileChinaColombiaCongoCosta RicaCroatiaCubaCzechoslovakiaDenmarkDominicaDominican RepublicEastern AfricaEastern AsiaEastern EuropeEcuadorEgyptEl SalvadorEnglandEritreaEthiopiaEuropeFijiFranceGermanyGhanaGreeceGrenadaGuatemalaGuyanaHaitiHondurasHong KongHungaryIndiaIndonesiaIranIraqIrelandIsraelItalyJamaicaJapanJordanKazakhstanKenyaKoreaKuwaitLaosLatin AmericaLatviaLebanonLiberiaLithuaniaMalaysiaMexicoMicronesiaMiddle AfricaMoldovaMoroccoNepalNetherlandsNicaraguaNigeriaNorth AmericaNorth MacedoniaNorthern AfricaNorthern EuropeNorwayOceaniaPakistanPanamaPeruPhilippinesPolandPortugalRomaniaRussiaSaudi ArabiaScotlandSenegalSerbiaSierra LeoneSingaporeSomaliaSouth AfricaSouth AmericaSouth Central AsiaSouth Eastern AsiaSouthern EuropeSpainSri LankaSt. Vincent and the GrenadinesSudanSwedenSwitzerlandSyriaTaiwanThailandTrinidad and TobagoTurkeyUgandaUkraineUruguayUzbekistanVenezuelaVietnamWest IndiesWestern AfricaWestern AsiaWestern EuropeYemenZaireZimbabweAzores
In Labor Force | Age 25-29
Income
Poverty
Unemployment
Labor Participation
Family Structure
Vehicle Availability
Education Level
Disability

In Labor Force | Age 25-29 Comparison

Trinidadians and Tobagonians

Immigrants from Egypt

Tragic
Exceptional
83.9%
IN LABOR FORCE | AGE 25-29
0.7/ 100
METRIC RATING
240th/ 347
METRIC RANK
85.2%
IN LABOR FORCE | AGE 25-29
97.7/ 100
METRIC RATING
78th/ 347
METRIC RANK

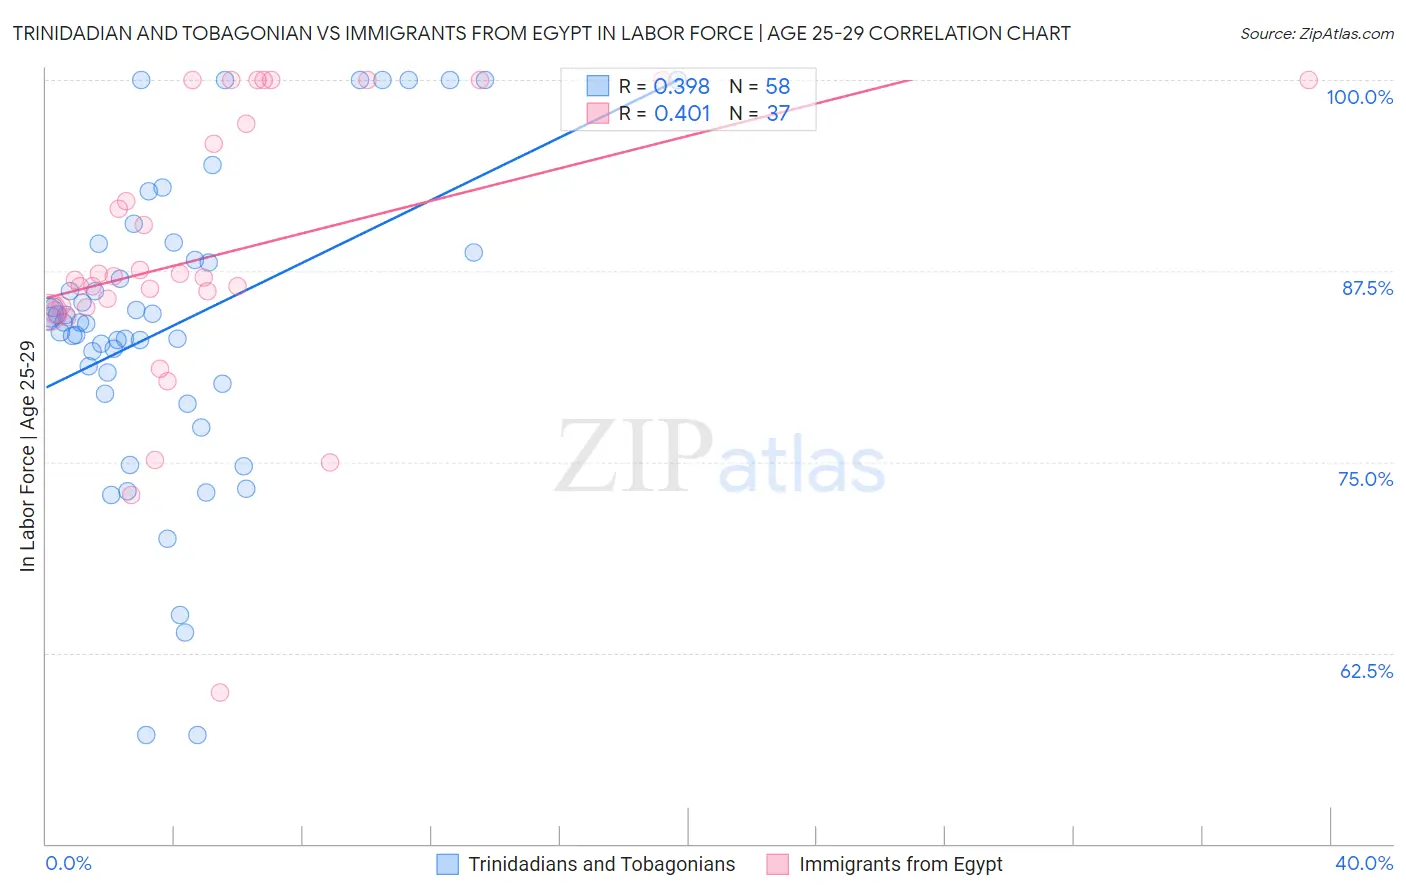
Trinidadian and Tobagonian vs Immigrants from Egypt In Labor Force | Age 25-29 Correlation Chart

The statistical analysis conducted on geographies consisting of 219,834,546 people shows a mild positive correlation between the proportion of Trinidadians and Tobagonians and labor force participation rate among population between the ages 25 and 29 in the United States with a correlation coefficient (R) of 0.398 and weighted average of 83.9%. Similarly, the statistical analysis conducted on geographies consisting of 245,441,194 people shows a moderate positive correlation between the proportion of Immigrants from Egypt and labor force participation rate among population between the ages 25 and 29 in the United States with a correlation coefficient (R) of 0.401 and weighted average of 85.2%, a difference of 1.6%.
Trinidadian and Tobagonian vs Immigrants from Egypt In Labor Force | Age 25-29

In Labor Force | Age 25-29 Correlation Summary

MeasurementTrinidadian and TobagonianImmigrants from Egypt
Minimum57.1%59.9%
Maximum100.0%100.0%
Range42.9%40.1%
Mean83.9%88.6%
Median84.2%87.1%
Interquartile 25% (IQ1)80.1%85.0%
Interquartile 75% (IQ3)88.7%98.6%
Interquartile Range (IQR)8.6%13.6%
Standard Deviation (Sample)10.0%9.1%
Standard Deviation (Population)9.9%9.0%

Similar Demographics by In Labor Force | Age 25-29

Demographics Similar to Trinidadians and Tobagonians by In Labor Force | Age 25-29

In terms of in labor force | age 25-29, the demographic groups most similar to Trinidadians and Tobagonians are Jamaican (83.9%, a difference of 0.0%), Immigrants from Uzbekistan (83.9%, a difference of 0.010%), Alsatian (83.9%, a difference of 0.020%), Iraqi (83.9%, a difference of 0.040%), and Guamanian/Chamorro (83.9%, a difference of 0.040%).
DemographicsRating | RankIn Labor Force | Age 25-29
Immigrants | Western Asia
2.7
/100
|
#233
Tragic
84.1%
Barbadians
1.0
/100
|
#234
Tragic
83.9%
Iraqis
0.9
/100
|
#235
Tragic
83.9%
Guamanians/Chamorros
0.9
/100
|
#236
Tragic
83.9%
Immigrants | Immigrants
0.9
/100
|
#237
Tragic
83.9%
Immigrants | Uzbekistan
0.8
/100
|
#238
Tragic
83.9%
Jamaicans
0.8
/100
|
#239
Tragic
83.9%
Trinidadians and Tobagonians
0.7
/100
|
#240
Tragic
83.9%
Alsatians
0.7
/100
|
#241
Tragic
83.9%
U.S. Virgin Islanders
0.6
/100
|
#242
Tragic
83.8%
Salvadorans
0.5
/100
|
#243
Tragic
83.8%
Immigrants | Jamaica
0.4
/100
|
#244
Tragic
83.8%
Iroquois
0.4
/100
|
#245
Tragic
83.8%
Cree
0.3
/100
|
#246
Tragic
83.8%
Immigrants | El Salvador
0.3
/100
|
#247
Tragic
83.7%

Demographics Similar to Immigrants from Egypt by In Labor Force | Age 25-29

In terms of in labor force | age 25-29, the demographic groups most similar to Immigrants from Egypt are Immigrants from Northern Africa (85.2%, a difference of 0.010%), Immigrants from Zimbabwe (85.2%, a difference of 0.010%), Immigrants from South Central Asia (85.2%, a difference of 0.020%), German (85.3%, a difference of 0.030%), and Immigrants from Northern Europe (85.2%, a difference of 0.030%).
DemographicsRating | RankIn Labor Force | Age 25-29
Kenyans
99.0
/100
|
#71
Exceptional
85.4%
Immigrants | Australia
98.9
/100
|
#72
Exceptional
85.3%
Russians
98.8
/100
|
#73
Exceptional
85.3%
Soviet Union
98.5
/100
|
#74
Exceptional
85.3%
Brazilians
98.3
/100
|
#75
Exceptional
85.3%
Germans
98.1
/100
|
#76
Exceptional
85.3%
Immigrants | South Central Asia
97.9
/100
|
#77
Exceptional
85.2%
Immigrants | Egypt
97.7
/100
|
#78
Exceptional
85.2%
Immigrants | Northern Africa
97.6
/100
|
#79
Exceptional
85.2%
Immigrants | Zimbabwe
97.6
/100
|
#80
Exceptional
85.2%
Immigrants | Northern Europe
97.2
/100
|
#81
Exceptional
85.2%
Okinawans
97.0
/100
|
#82
Exceptional
85.2%
Immigrants | Europe
96.8
/100
|
#83
Exceptional
85.2%
Immigrants | Eastern Europe
96.8
/100
|
#84
Exceptional
85.2%
Immigrants | Africa
96.7
/100
|
#85
Exceptional
85.2%